Fig. 5.
Download original image
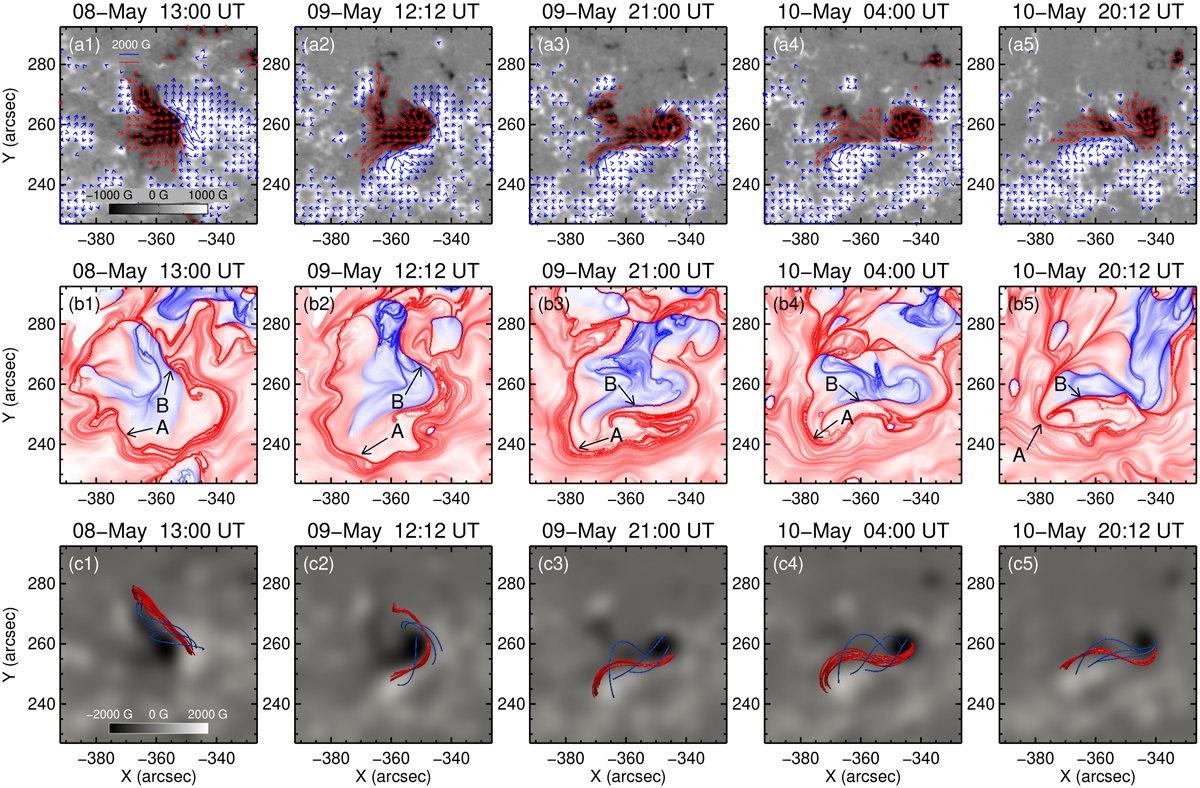
Magnetic fields at the origin site of flares. (a1)–(a5) HMI vector magnetograms just before the occurrence of five M-class flares. The length and orientation of each blue or red arrow represent the strength and direction of the horizontal magnetic field therein. (b1)–(b5) Corresponding squashing factor Q maps. The arrows labeled “A” and “B” denote the high Q regions coinciding with the circular ribbon and main PIL of the bipolar region, respectively. (c1)–(c5) Top view of the reconstructed coronal structures. The red and blue curves represent the magnetic flux ropes and the overlying loops, respectively.
Current usage metrics show cumulative count of Article Views (full-text article views including HTML views, PDF and ePub downloads, according to the available data) and Abstracts Views on Vision4Press platform.
Data correspond to usage on the plateform after 2015. The current usage metrics is available 48-96 hours after online publication and is updated daily on week days.
Initial download of the metrics may take a while.