Fig. 3.
Download original image
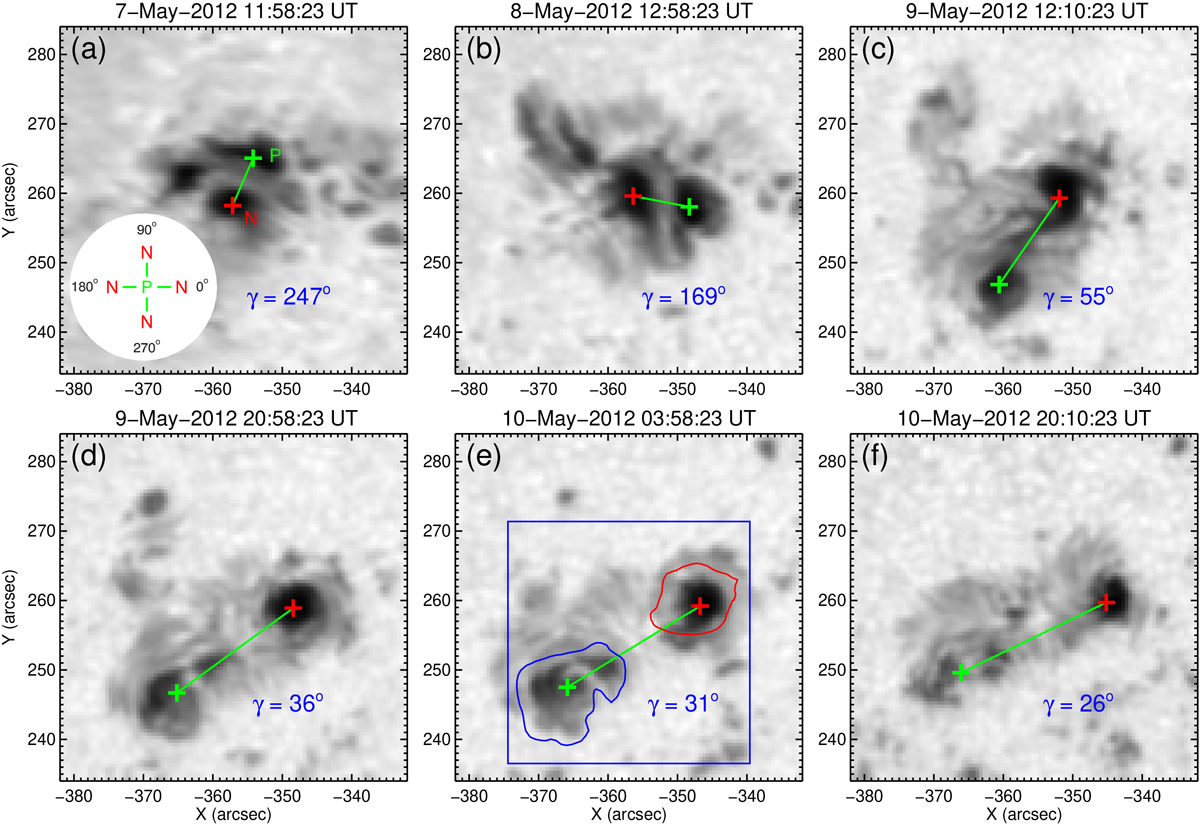
Sequence of HMI intensitygrams displaying the shearing motion of the bipolar sunspots. The green and red plus symbols, connected by the green lines, mark the intensity centroids of the sunspots with positive (P) and negative (N) polarities, respectively. The orientation, γ, is defined as varying within the range of [0, 360]°, as is illustrated in the inset circular image in (a). The box in (e) outlines the field of view (FOV) of Fig. 4, and the blue and red curves are the contours of the positive and negative magnetic fields at ±500 G levels. An animation (Movie1.mp4) of this figure is available online.
Current usage metrics show cumulative count of Article Views (full-text article views including HTML views, PDF and ePub downloads, according to the available data) and Abstracts Views on Vision4Press platform.
Data correspond to usage on the plateform after 2015. The current usage metrics is available 48-96 hours after online publication and is updated daily on week days.
Initial download of the metrics may take a while.