Fig. 2.
Download original image
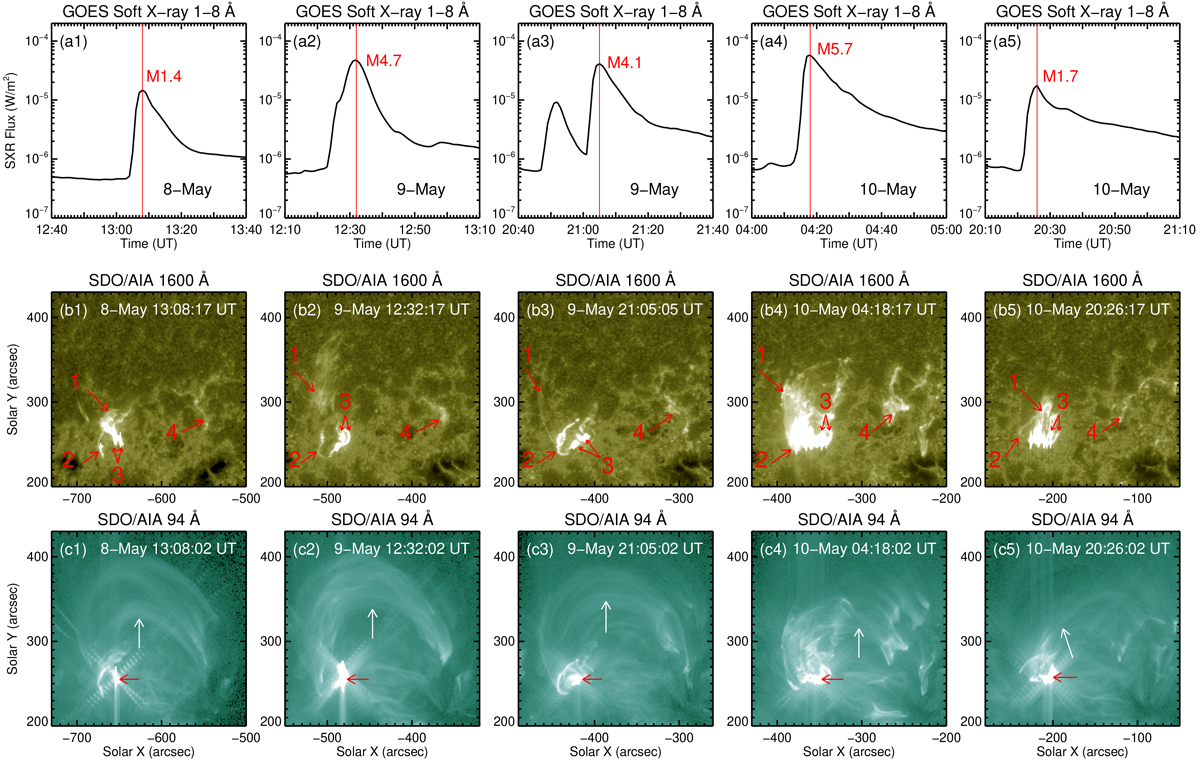
Appearance of the five homologous flares. (a1)–(a5) GOES soft X-ray flux in 1−8 Å showing the M1.4, M4.7, M4.1, M5.7, and M1.7 flares. (b1)–(b5) AIA 1600 Å and (c1)–(c5) AIA 94 Å images showing the five flares in UV and EUV wavelengths, respectively. The vertical lines in the top panels mark the peak times of the flares. The arrows labeled “1”, “2”, “3”, and “4” in the middle panels denote the erupting materials, the circular ribbons, the parallel ribbons, and the remote brightenings, respectively. The red and white arrows in the bottom panels indicate the bright kernels and large-scale loops, respectively.
Current usage metrics show cumulative count of Article Views (full-text article views including HTML views, PDF and ePub downloads, according to the available data) and Abstracts Views on Vision4Press platform.
Data correspond to usage on the plateform after 2015. The current usage metrics is available 48-96 hours after online publication and is updated daily on week days.
Initial download of the metrics may take a while.