Fig. 1.
Download original image
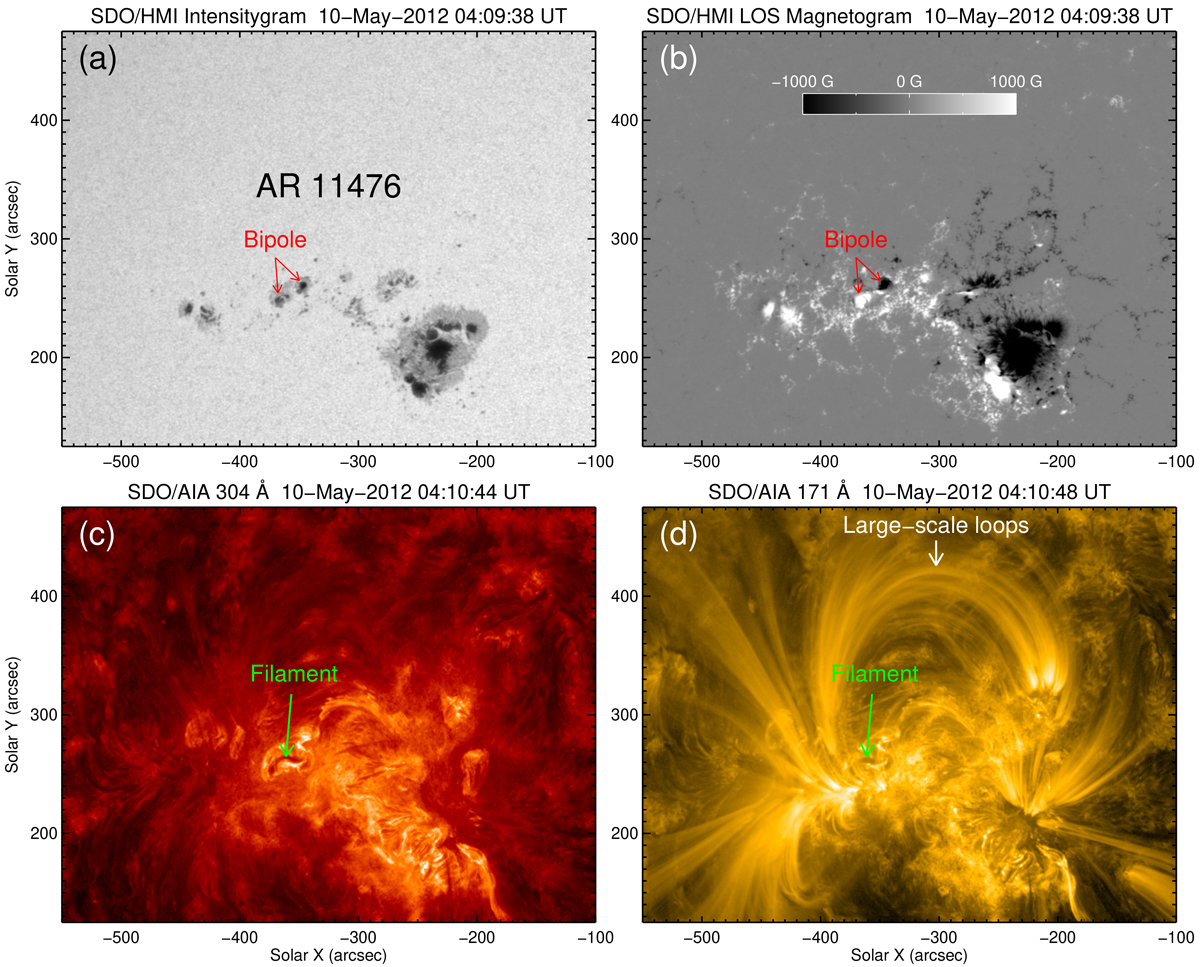
Overview of AR 11476 on May 10, 2012. (a)–(b) HMI intensitygram and LOS magnetogram displaying the sunspots and the corresponding magnetic fields in the photosphere. (c)–(d) AIA 304 Å and 171 Å images showing the appearance of overlying structures. The arrows in (a)–(b) denote a pair of sunspots with opposite polarities, i.e., a bipole. The green arrows in (c)–(d) indicate a filament, and the white arrow in (d) denotes a set of large-scale loops.
Current usage metrics show cumulative count of Article Views (full-text article views including HTML views, PDF and ePub downloads, according to the available data) and Abstracts Views on Vision4Press platform.
Data correspond to usage on the plateform after 2015. The current usage metrics is available 48-96 hours after online publication and is updated daily on week days.
Initial download of the metrics may take a while.