Open Access
Fig. A.1
Download original image
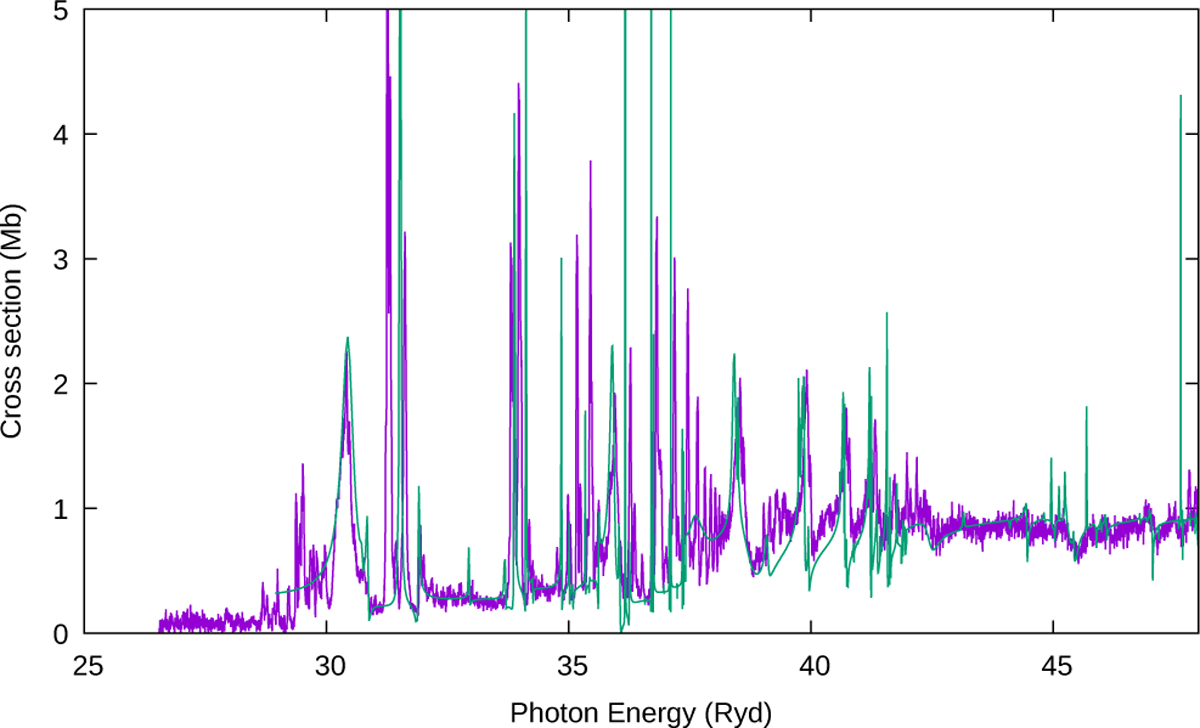
Comparison of the measured (Hernández et al. 2015, purple line) and calculated P III ground state photoionisation cross-section (Butler, in prep., green). The measured data have been scaled by a factor of 1.3
Current usage metrics show cumulative count of Article Views (full-text article views including HTML views, PDF and ePub downloads, according to the available data) and Abstracts Views on Vision4Press platform.
Data correspond to usage on the plateform after 2015. The current usage metrics is available 48-96 hours after online publication and is updated daily on week days.
Initial download of the metrics may take a while.