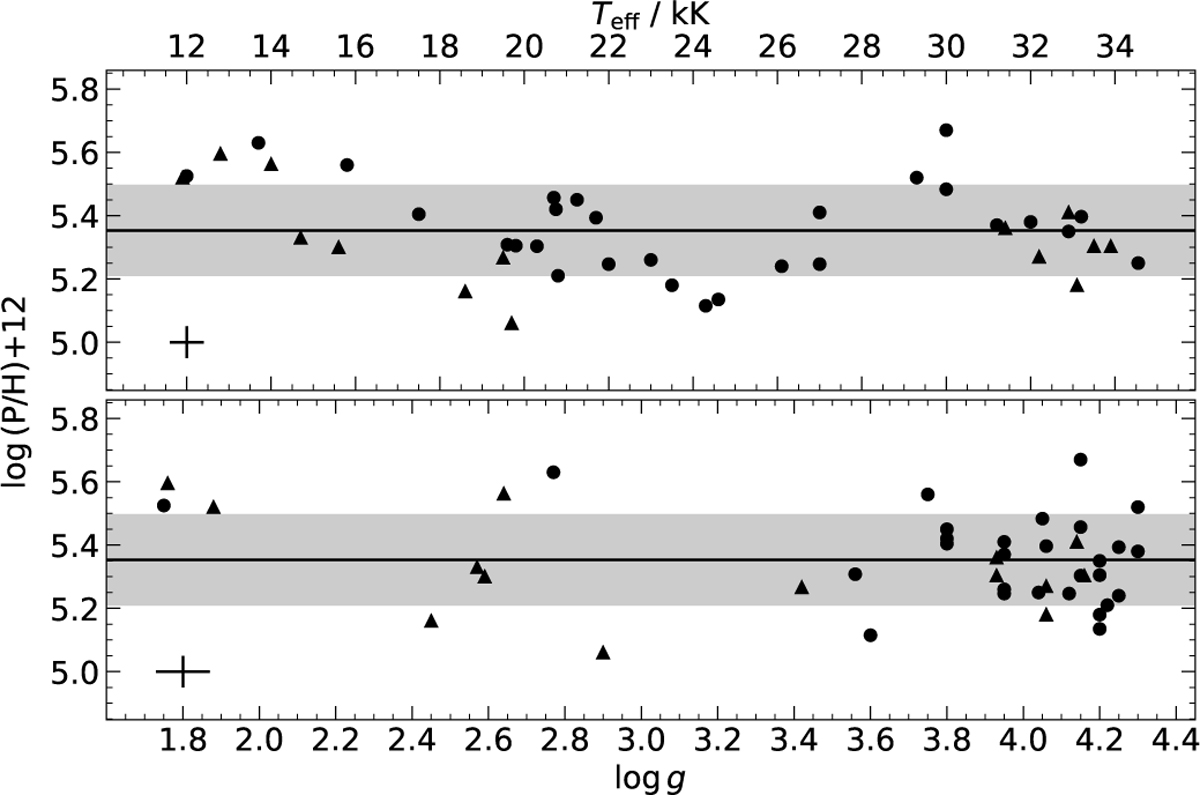
Fig. 4

Download original image
Phosphorus abundances as a function of fundamental stellar parameters for all sample stars. Upper panel: phosphorus abundance as a function of Teff . Lower panel: phosphorus abundance as a function of log g. The black line shows the mean value, the shaded area indicates the 1σ standard deviation. The typical uncertainties are indicated in the bottom left corner. Objects farther away than 500 pc are marked with triangles; those closer are marked with dots.
Current usage metrics show cumulative count of Article Views (full-text article views including HTML views, PDF and ePub downloads, according to the available data) and Abstracts Views on Vision4Press platform.
Data correspond to usage on the plateform after 2015. The current usage metrics is available 48-96 hours after online publication and is updated daily on week days.
Initial download of the metrics may take a while.


