Open Access
Fig. 3
Download original image
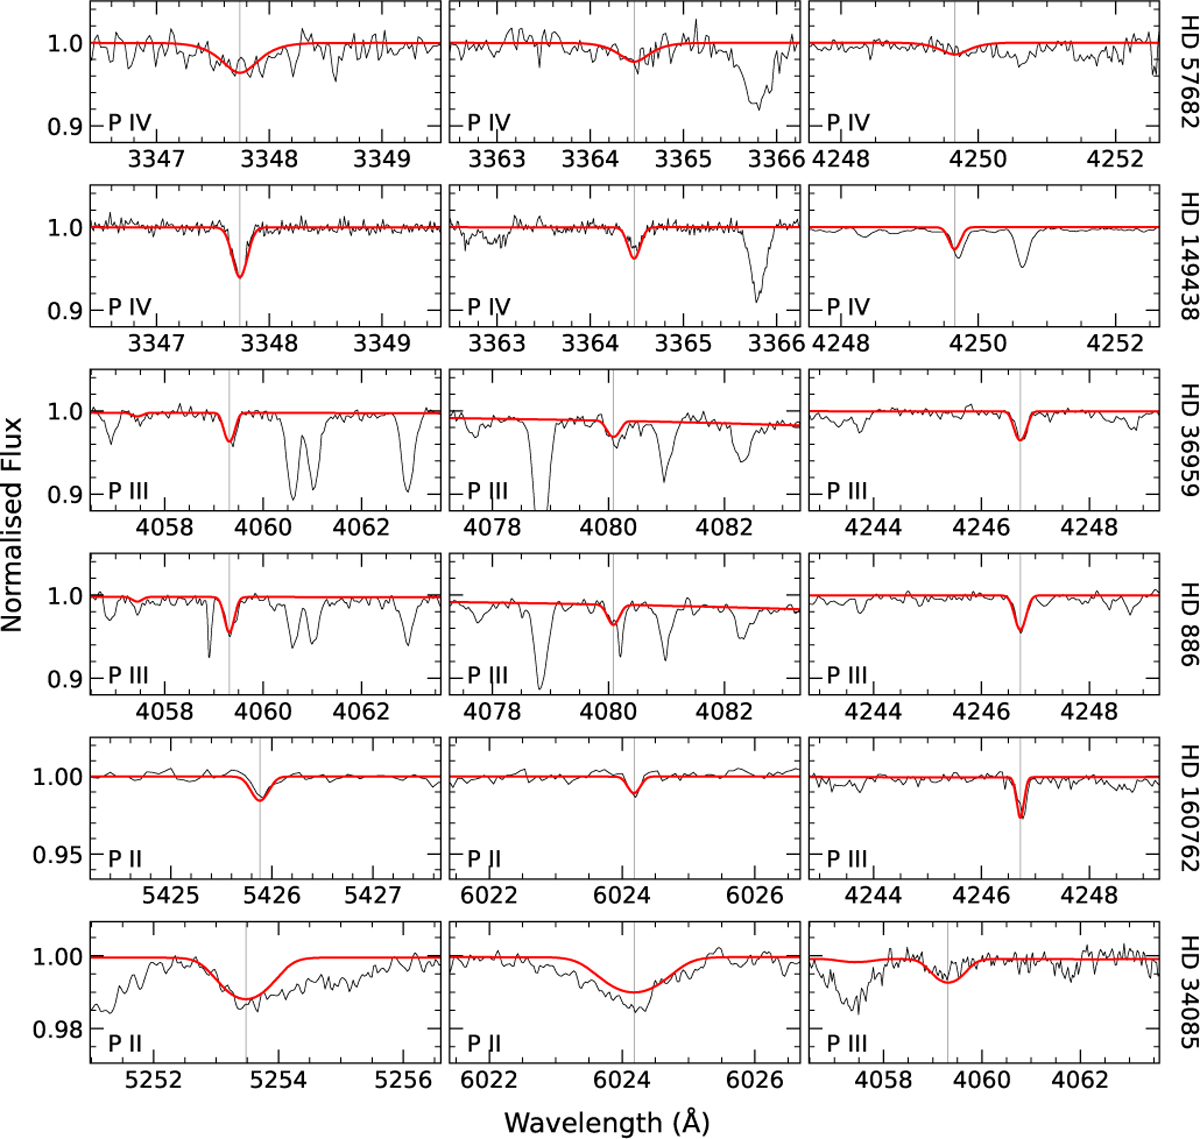
Global best fitting model shown for six different sample stars along the Teff -sequence (top to bottom). Each row shows the phosphorus lines for a single star. The line centres are marked by a grey vertical line. The ionic species of each line shown is shown at the bottom left of each panel.
Current usage metrics show cumulative count of Article Views (full-text article views including HTML views, PDF and ePub downloads, according to the available data) and Abstracts Views on Vision4Press platform.
Data correspond to usage on the plateform after 2015. The current usage metrics is available 48-96 hours after online publication and is updated daily on week days.
Initial download of the metrics may take a while.