Fig. 1
Download original image
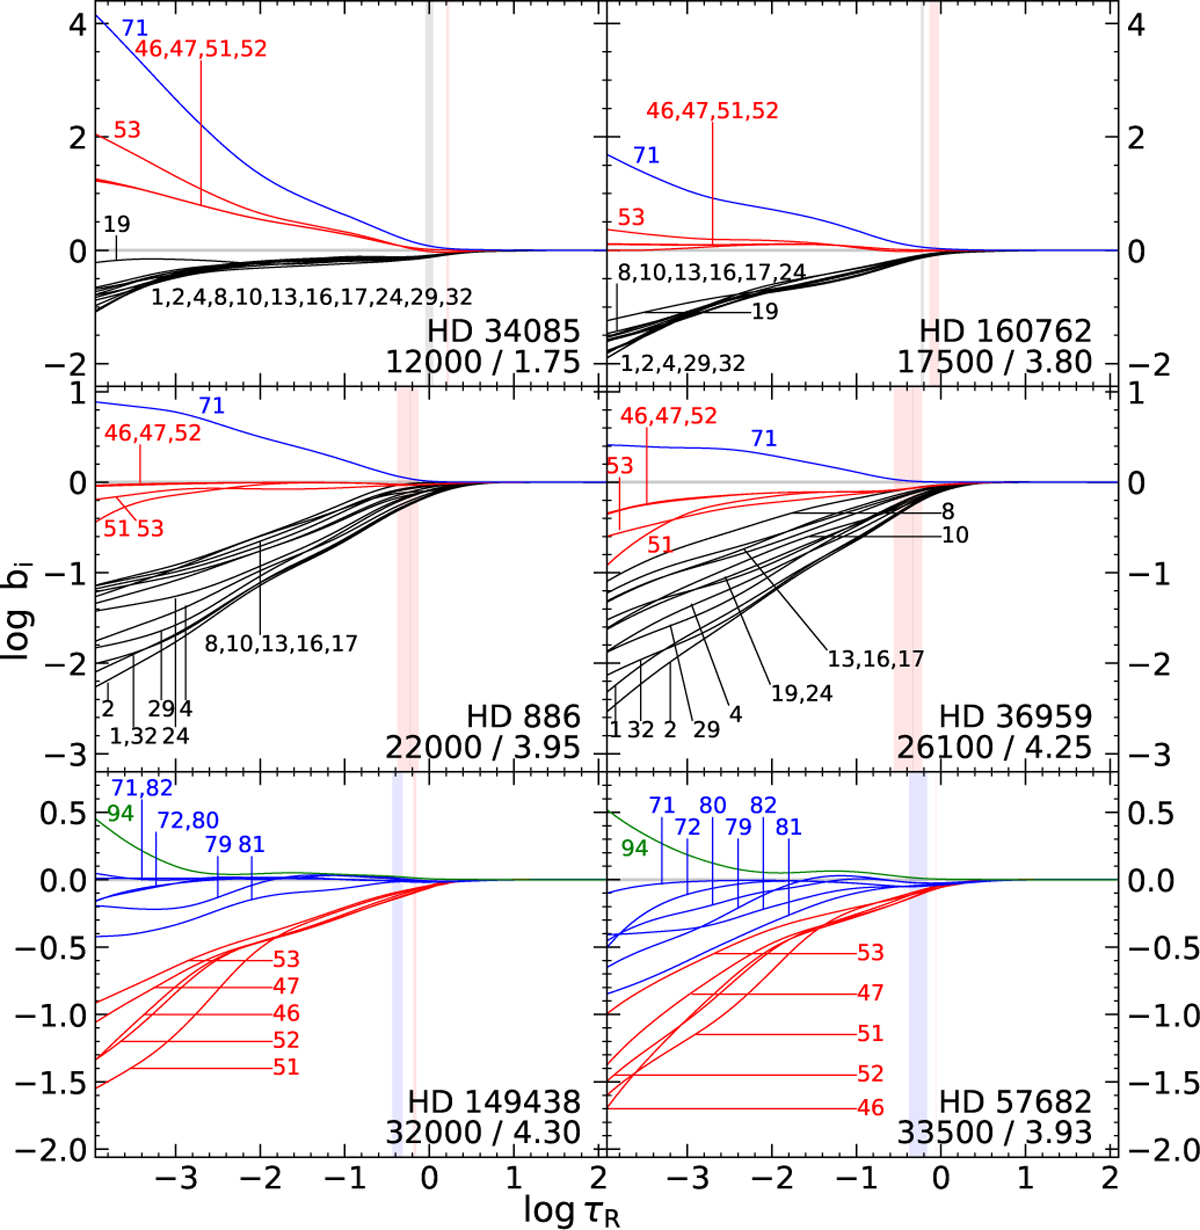
Departure coefficients bi for P II (black), P III (red), P IV (blue), and P V (green) levels as a function of the Rosseland optical depth τR for the six selected sample stars. In the bottom right of each plot the name of the star together with its Teff and log g-value are given. The colourmatching shaded areas indicate the formation depth of the strongest observed line for each ion. The curves are labelled with the identifiers listed in Table 3.
Current usage metrics show cumulative count of Article Views (full-text article views including HTML views, PDF and ePub downloads, according to the available data) and Abstracts Views on Vision4Press platform.
Data correspond to usage on the plateform after 2015. The current usage metrics is available 48-96 hours after online publication and is updated daily on week days.
Initial download of the metrics may take a while.