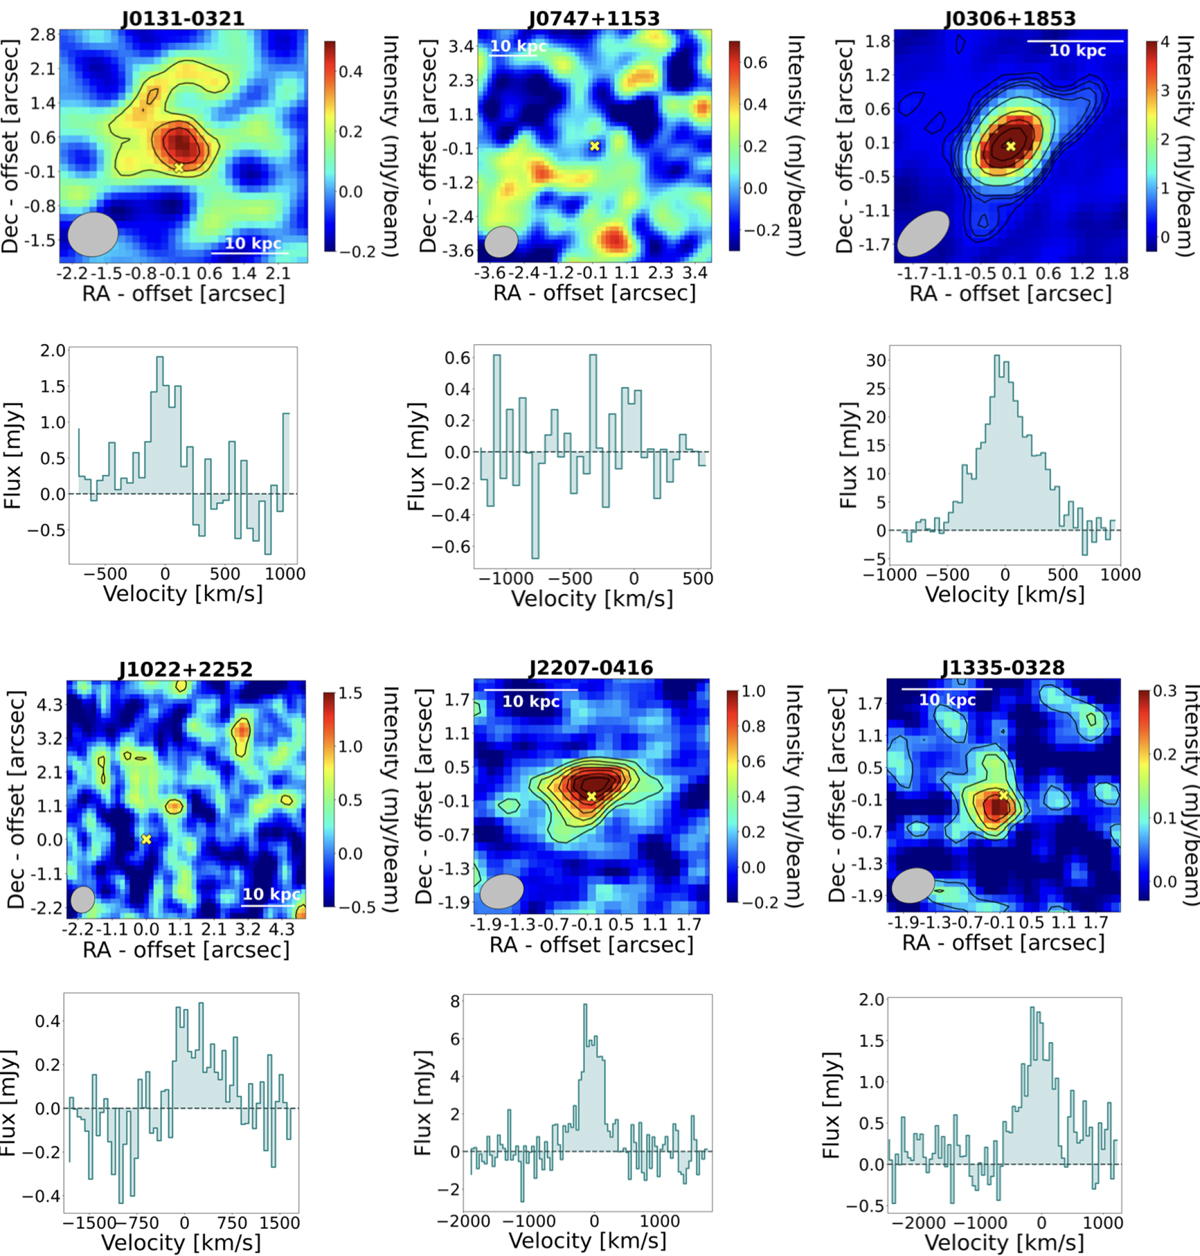
Fig. 4.
Download original image
Two-dimensional velocity-integrated [C II] line emission maps (upper panels) and spectral profiles (lower panels) for the six analysed sources from Table 3. The yellow crosses in the line maps refer to the optical position of quasars, as retrieved from the SDSS (Wang et al. 2016). In the same maps, we also report contour lines at 2, 3, 4σ for J0131-0321, from 2 to 50σ for J0306+1853, from 2 to 8σ for J2207-0416, from 2 to 5σ for J1335-0328 and the 2σ contours for J1022+2252. Concerning in particular J1022+2252, we find no evidence of [C II] emission in correspondence of the quasar optical position, although a weak signal (S/N ∼ 3, also displayed in the correspondent lower panel) is detected with an offset of more than 2 arcsec. Instead J0747+1153 shows no evidence of [C II] emission.
Current usage metrics show cumulative count of Article Views (full-text article views including HTML views, PDF and ePub downloads, according to the available data) and Abstracts Views on Vision4Press platform.
Data correspond to usage on the plateform after 2015. The current usage metrics is available 48-96 hours after online publication and is updated daily on week days.
Initial download of the metrics may take a while.