Open Access
Fig. 2.
Download original image
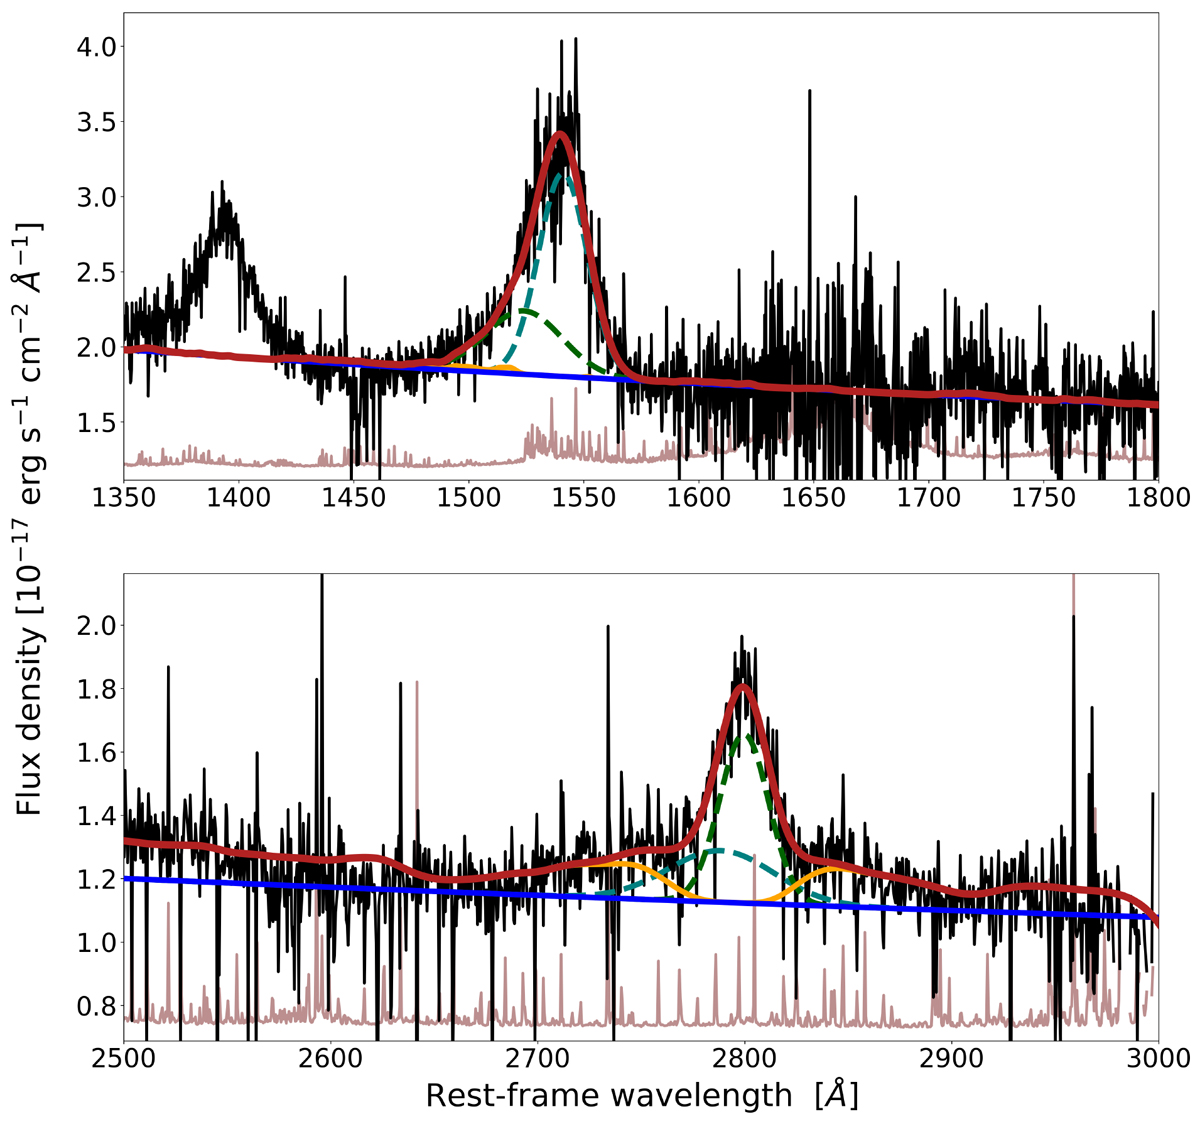
Best-fit decomposition of C IV (upper panel) and Mg II (lower panel) spectral regions for J2226-0618. The blue line is the power law continuum, the orange line is the Fe II template, green dashed lines show Gaussian components. The Si IV emission line at ∼1400 Å is masked during the fitting procedure.
Current usage metrics show cumulative count of Article Views (full-text article views including HTML views, PDF and ePub downloads, according to the available data) and Abstracts Views on Vision4Press platform.
Data correspond to usage on the plateform after 2015. The current usage metrics is available 48-96 hours after online publication and is updated daily on week days.
Initial download of the metrics may take a while.