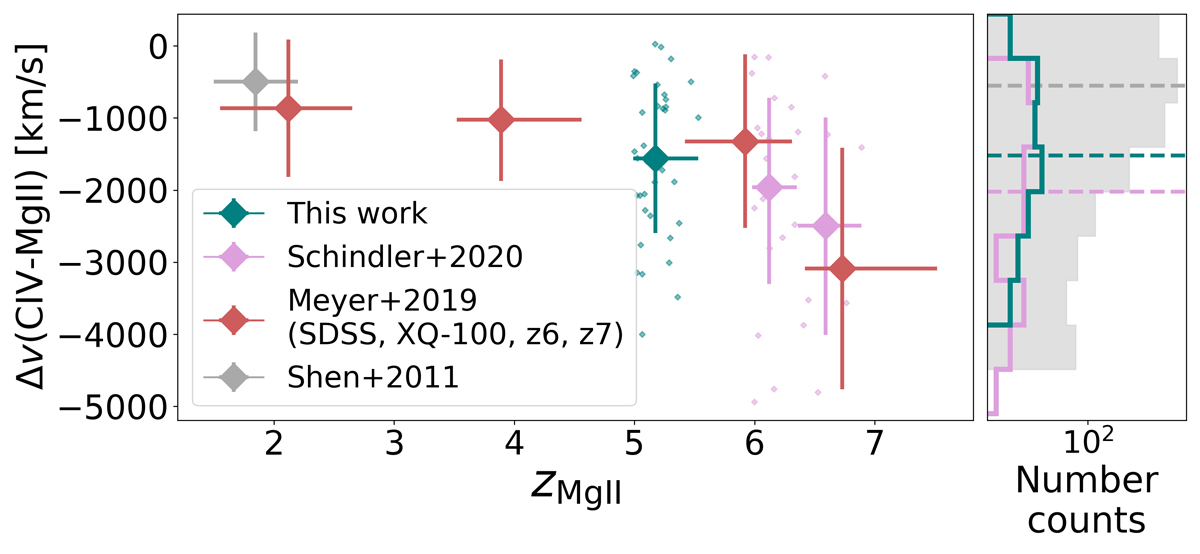
Fig. 14.
Download original image
Mean C IV-Mg II velocity shift as a function of redshift from Mg II for our quasar sample (teal diamond), for the z > 5.8 dataset from Schindler et al. (2020), further divided into two redshift bins at z ≷ 6.35, and for a compilation of different samples collected in Meyer et al. (2019), for instance: SDSS DR7 and DR12, XQ-100 and z ∼ 6 − 7 quasars from Bosman et al. (2018) and Schneider et al. (2010), Shen et al. (2011), respectively. The x-axis bars mark the redshift range of each sample, while the errorbars on the y-axis report the standard deviation in each bin.
Current usage metrics show cumulative count of Article Views (full-text article views including HTML views, PDF and ePub downloads, according to the available data) and Abstracts Views on Vision4Press platform.
Data correspond to usage on the plateform after 2015. The current usage metrics is available 48-96 hours after online publication and is updated daily on week days.
Initial download of the metrics may take a while.