Fig. 1.
Download original image
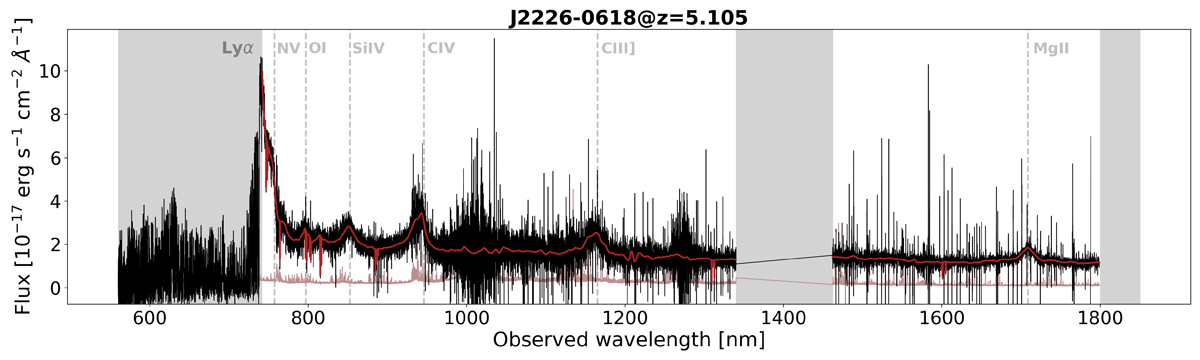
Example of a typical X-Shooter spectrum from our quasar sample, covering the 560–1850 nm observed range, reported in black. In pink we display the associated error. The red curve comprises the ASTROCOOK continuum and emission lines best fit, as well as the identified absorption systems. We label the main emission lines typically identified in quasar spectra. The Lyα forest and telluric-contaminated spectral regions are masked by gray-shaded regions and not fitted.
Current usage metrics show cumulative count of Article Views (full-text article views including HTML views, PDF and ePub downloads, according to the available data) and Abstracts Views on Vision4Press platform.
Data correspond to usage on the plateform after 2015. The current usage metrics is available 48-96 hours after online publication and is updated daily on week days.
Initial download of the metrics may take a while.