Fig. B.1.
Download original image
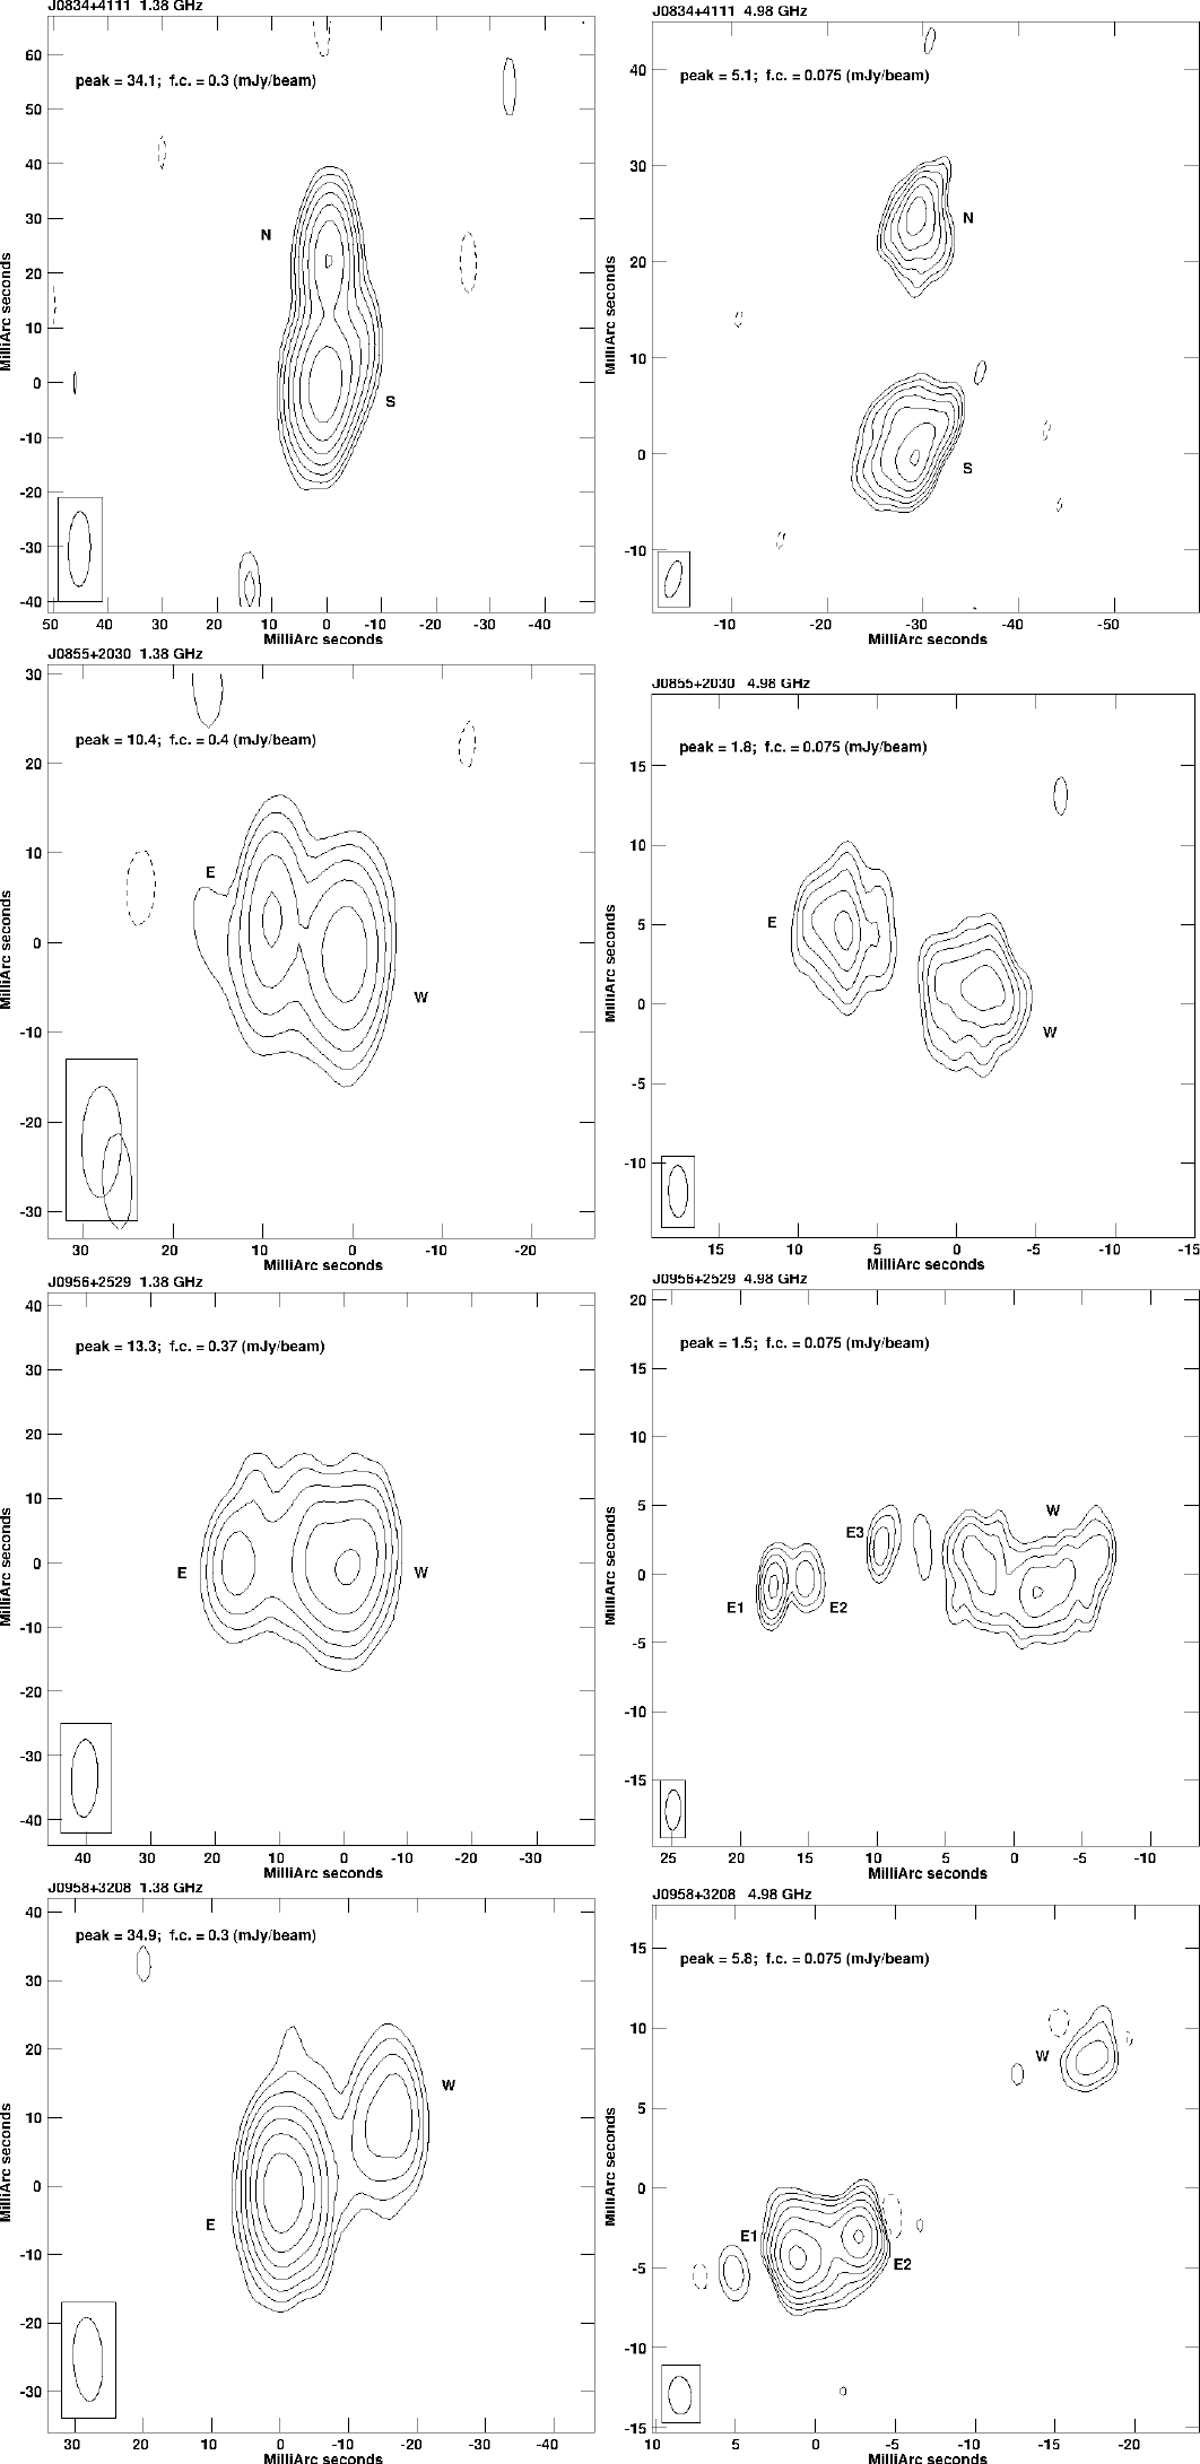
VLBA images at 1.38 (left) and at 4.98 GHz (right). In each image, we provide the source name, the observing frequency, the peak brightness, and the first contour (f.c.), which is three times the off-source noise level on the image plane. Contours increase by a factor of 2. The restoring beam is plotted in the bottom left-hand corner of each image.
Current usage metrics show cumulative count of Article Views (full-text article views including HTML views, PDF and ePub downloads, according to the available data) and Abstracts Views on Vision4Press platform.
Data correspond to usage on the plateform after 2015. The current usage metrics is available 48-96 hours after online publication and is updated daily on week days.
Initial download of the metrics may take a while.