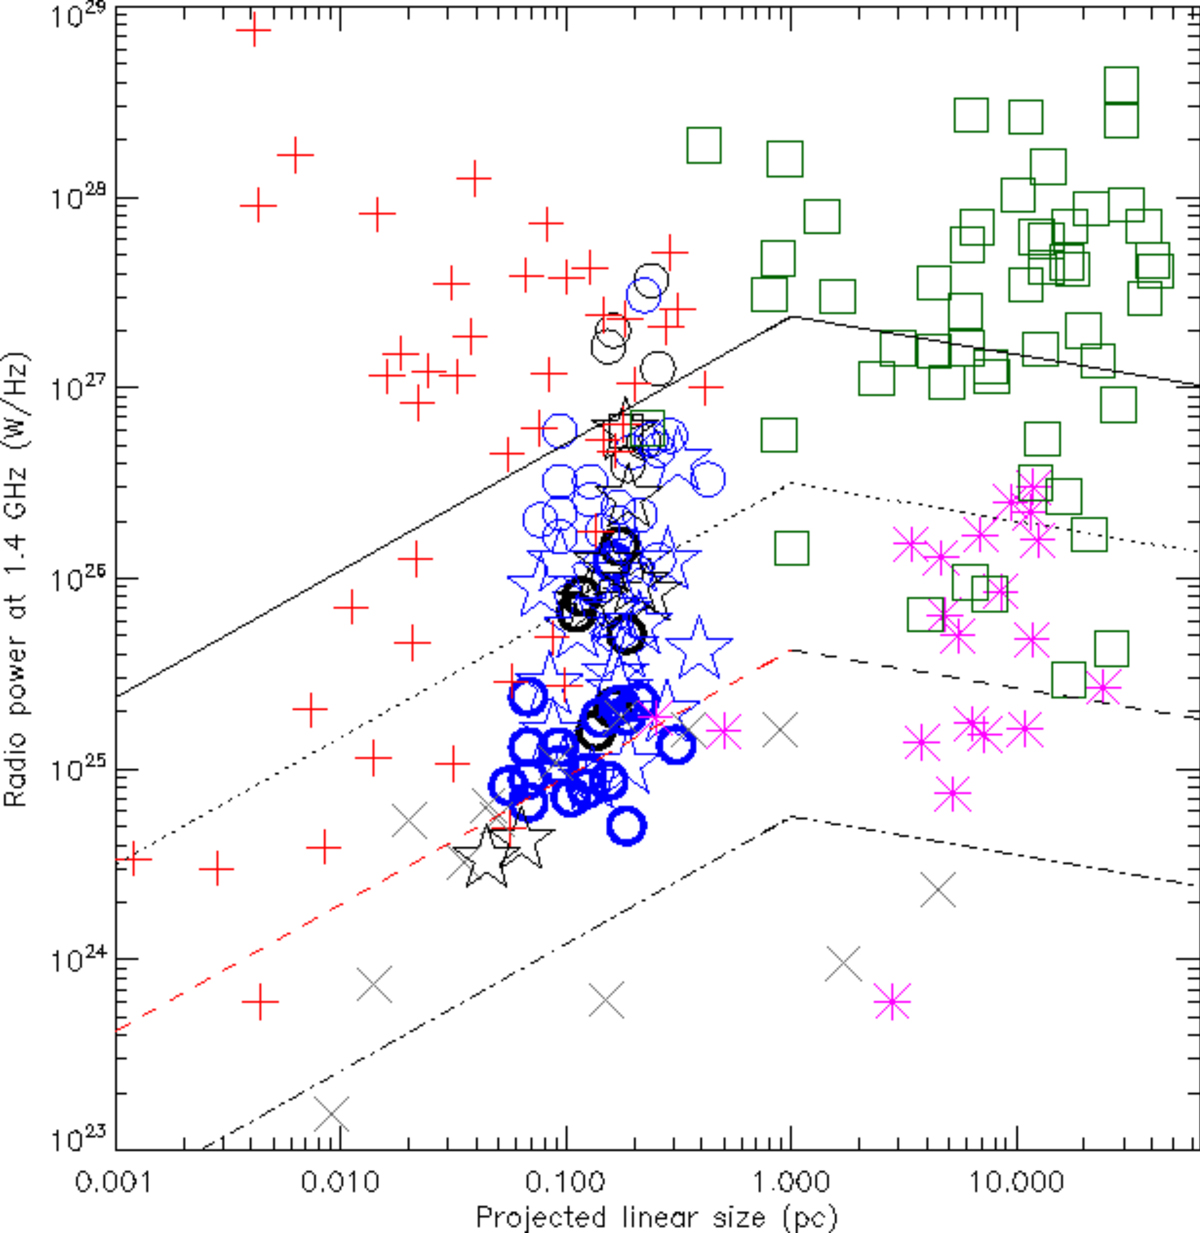
Fig. 3.
Download original image
Power versus size for the CSOs and MSOs from various samples: red plus signs are CSOs from An & Baan (2012), gray crosses are low-z CSOs from Snellen et al. (2004), magenta asterisks are MSOs from Kunert-Bajraszewska et al. (2010), and green squares are CSOs and MSOs from Fanti et al. (2001). Circles, triangles, and stars are the CSOs and CSO candidates from our sample: black symbols are CSOs already observed with the VLBA at 4.98 GHz (core-jet blazars have been removed), and the blue symbols are the remaining objects. Thick and thin symbols refer to values computed assuming redshifts of 0.5 and 2, respectively. Stars indicate objects with known redshifts. Illustrative evolutionary tracks are depicted for jet powers of 1046 erg s−1 (solid line), 1045 erg s−1 (dotted line), 1044 erg s−1 (dashed line), and 1043 erg s−1 (dash-dot line).
Current usage metrics show cumulative count of Article Views (full-text article views including HTML views, PDF and ePub downloads, according to the available data) and Abstracts Views on Vision4Press platform.
Data correspond to usage on the plateform after 2015. The current usage metrics is available 48-96 hours after online publication and is updated daily on week days.
Initial download of the metrics may take a while.