Fig. 4
Download original image
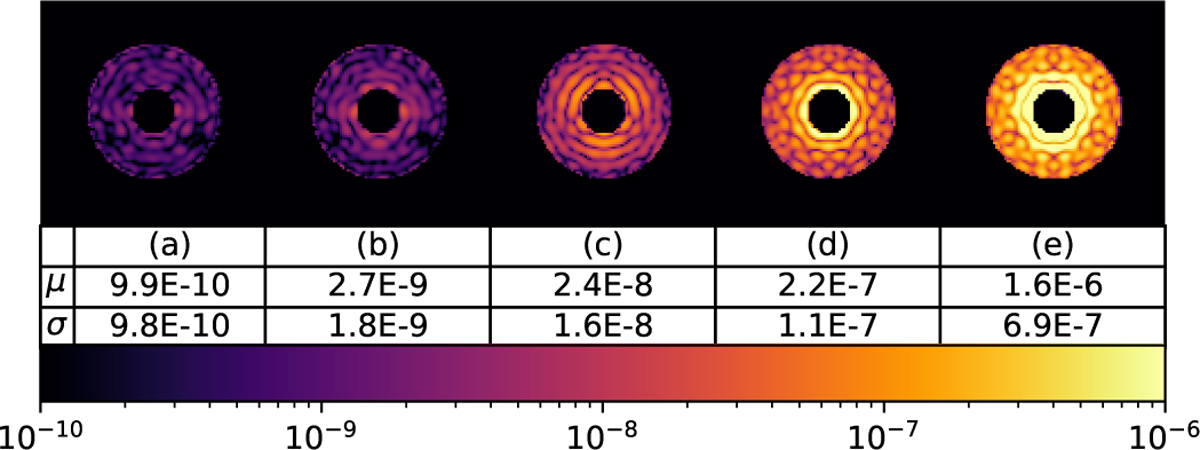
Simulated DH images (3–9 λ/D) for the five HLC mask solutions (a), (b), (c), (d), and (e) as described in the text and displayed in Fig. 3. They all share the colorbar indicated at the bottom of the figure. The mean, μ, and standard deviation, σ, of monochromatic contrast inside the DH are given in the table below each image. The imaging system was assumed aberration-free and no optimization of the DM shapes was applied as we modified the mask design.
Current usage metrics show cumulative count of Article Views (full-text article views including HTML views, PDF and ePub downloads, according to the available data) and Abstracts Views on Vision4Press platform.
Data correspond to usage on the plateform after 2015. The current usage metrics is available 48-96 hours after online publication and is updated daily on week days.
Initial download of the metrics may take a while.