Fig. 16
Download original image
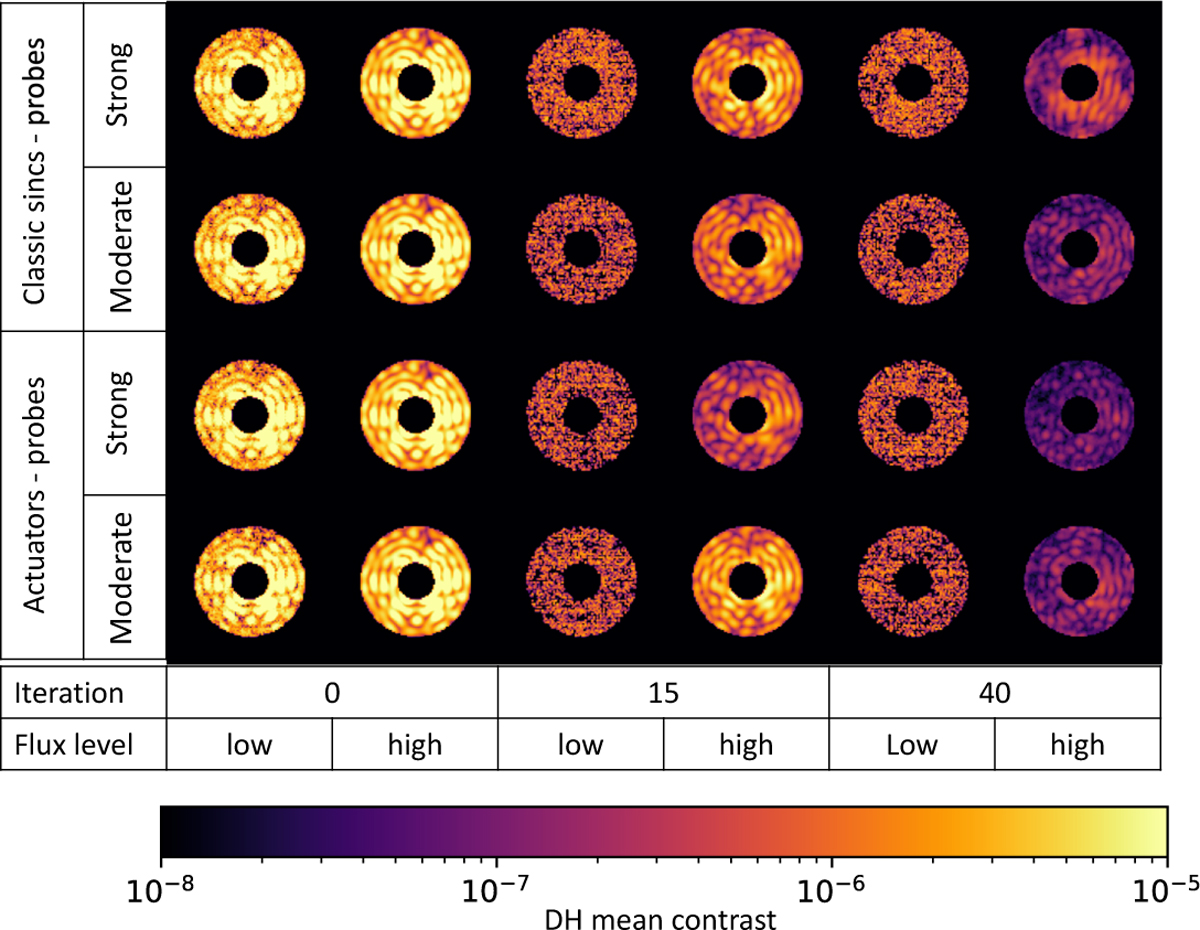
Visual comparison of DH images obtained during the experiment for various probe shapes (classic sinc and single-actuator) and probe amplitudes (strong and moderate) under low- and high-flux conditions. Rows represent the probe configurations (classic sinc and single-actuator), with each configuration tested for strong and moderate probe amplitudes. Columns depict iterations at flux levels transitioning from low to high.
Current usage metrics show cumulative count of Article Views (full-text article views including HTML views, PDF and ePub downloads, according to the available data) and Abstracts Views on Vision4Press platform.
Data correspond to usage on the plateform after 2015. The current usage metrics is available 48-96 hours after online publication and is updated daily on week days.
Initial download of the metrics may take a while.