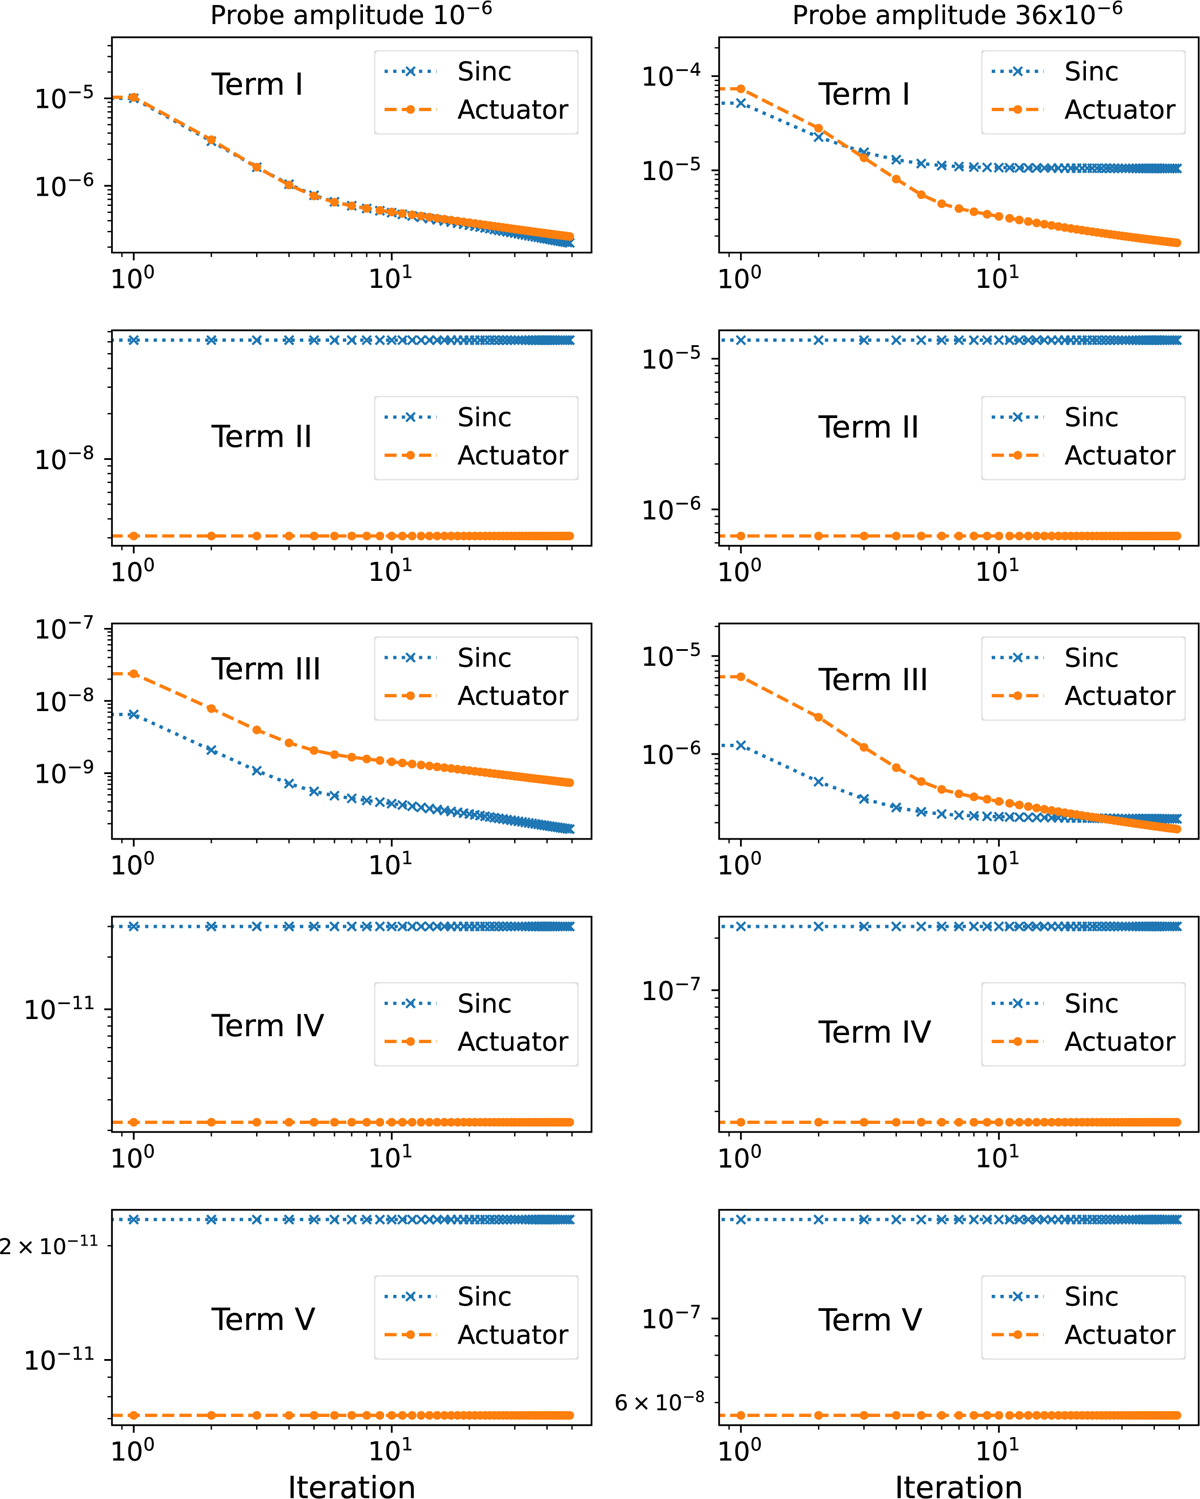
Fig. 14
Download original image
Evolution of the standard deviation for each term in Eq. (17) across the DH region during 50 iterations of a PW+EFC simulation. Results are shown for two shapes of probes: sinc-sinc-sine probes (blue crosses) and single-actuator probes (orange dashed lines), using probe amplitudes scaled to an added DH mean contrast of 10−6 (left column), and scaled up by a factor of 6, corresponding to an added DH mean contrast of 36 × 10−6 (right column). Each plot corresponds to a different term: Term I (linear approximation of ΔIim,j), Term II (dominant nonlinear term), Term III, Term IV, and Term V. While Terms II, IV, and V remain invariant across iterations, Term I and Term III depend on the aberrated electric field and decrease as the electric field improves. Notably, Term II starts dominating with the classic sinc probes as probe amplitude increases, and Term III decreases more rapidly for single-actuator probes compared to classic sinc probes.
Current usage metrics show cumulative count of Article Views (full-text article views including HTML views, PDF and ePub downloads, according to the available data) and Abstracts Views on Vision4Press platform.
Data correspond to usage on the plateform after 2015. The current usage metrics is available 48-96 hours after online publication and is updated daily on week days.
Initial download of the metrics may take a while.