Fig. 12
Download original image
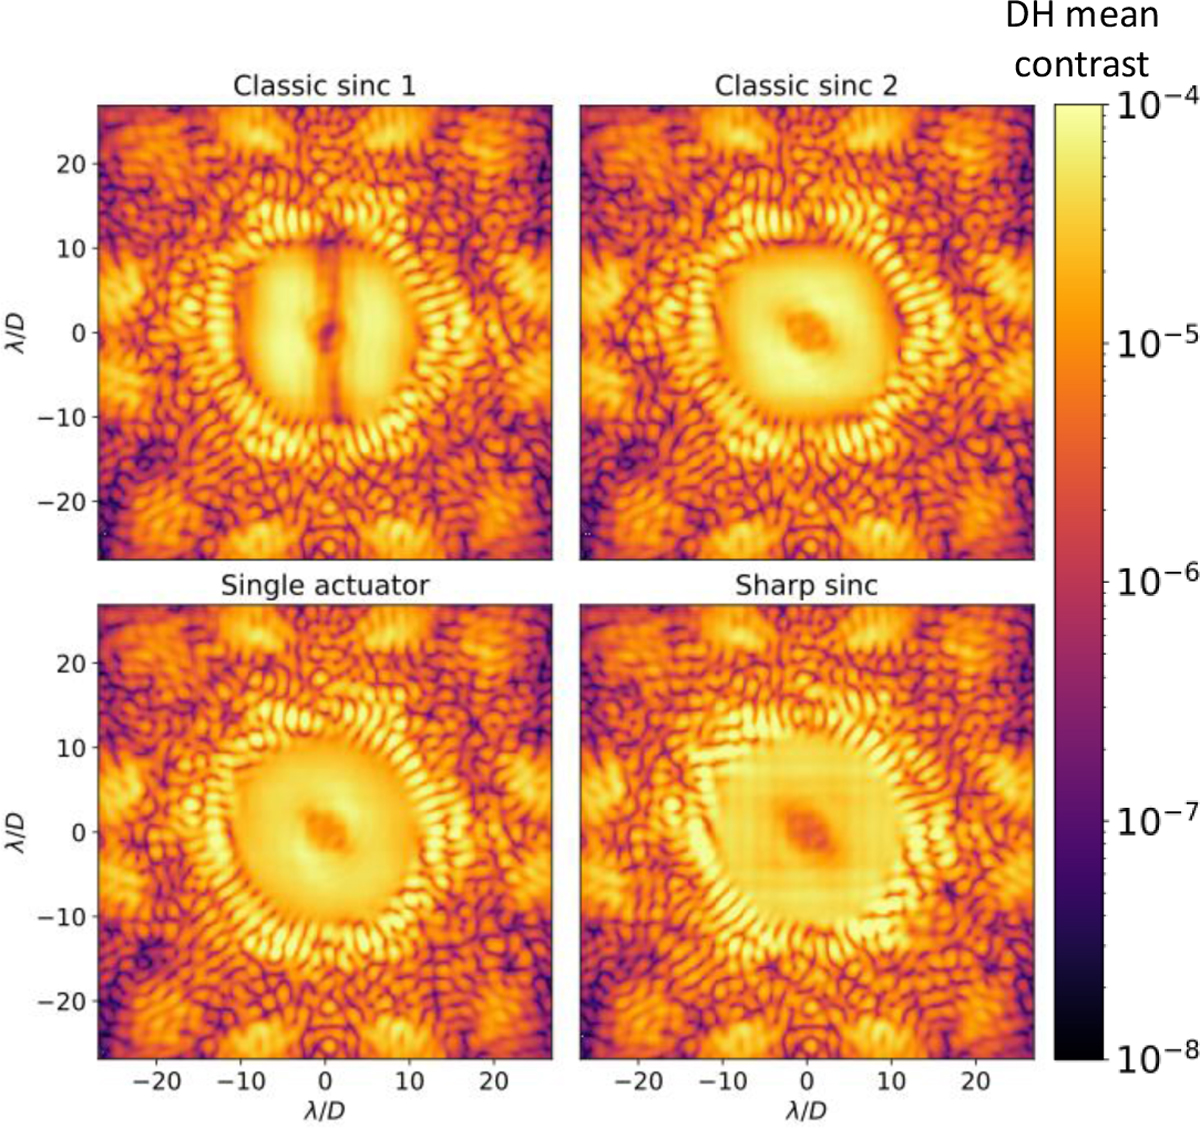
Probe images from experimental measurements showing the intensity distribution in the focal plane for different probe shapes at an added intensity of 36 × 10−6 in the DH. Top: two of the three sinc probes, as described in Sect. 4.1 and shown in Fig. 7. Bottom: single-actuator probe centered on actuator 297 (left) and a sharp sinc probe (right). The stripes in the bottom right panel originate from the sharp sinc probe itself; it is aliasing that is introduced by undersampling the sinc with respect to the highest Nyquist-sampled spatial frequency on the DM (see Eq. (14)). These very strong probes provide here a S/N of ~480, and would thus allow creating a DH on a fainter target, or with shorter exposure times.
Current usage metrics show cumulative count of Article Views (full-text article views including HTML views, PDF and ePub downloads, according to the available data) and Abstracts Views on Vision4Press platform.
Data correspond to usage on the plateform after 2015. The current usage metrics is available 48-96 hours after online publication and is updated daily on week days.
Initial download of the metrics may take a while.