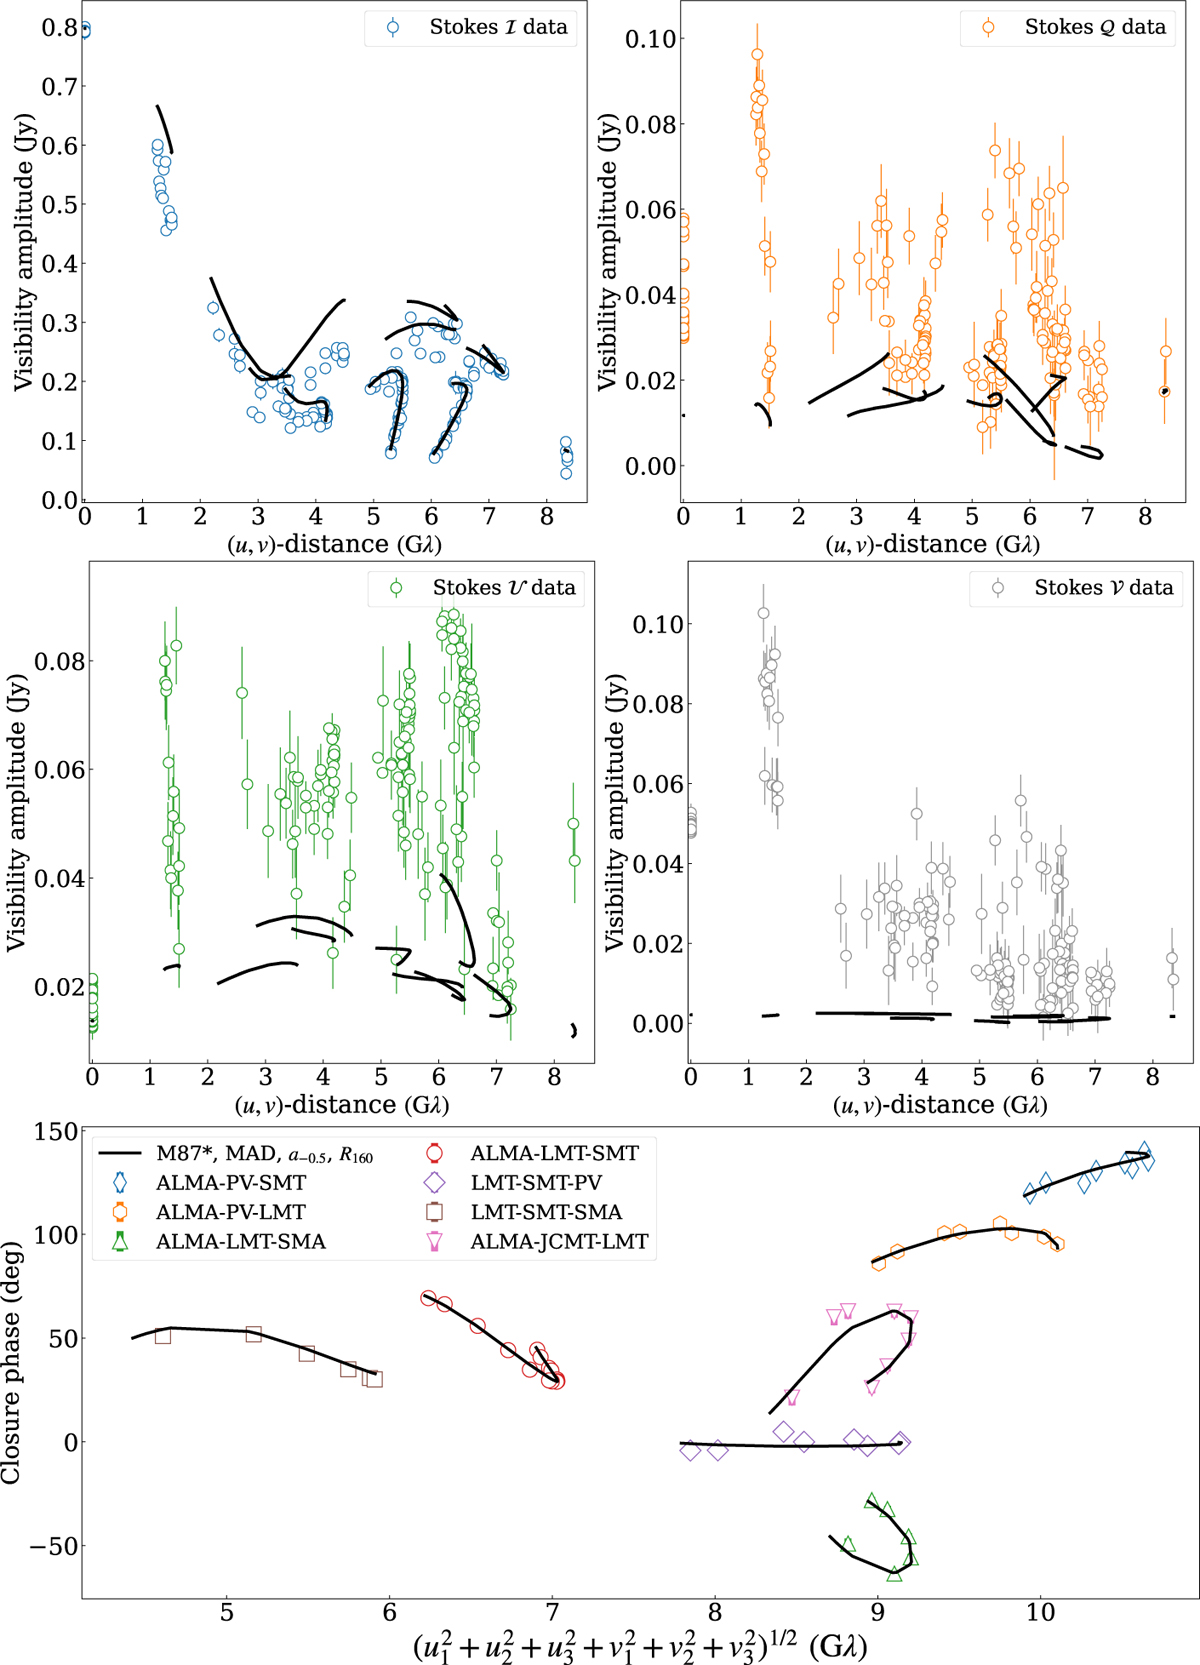
Fig. A.1
Download original image
Direct comparison of synthetic- and corresponding model data from the M87* MAD image of Figure 3. The four top panels show amplitudes of the different Stokes parameters being primarily affected by RCP, LCP gain errors and 𝒟-terms. The closure phases shown in the bottom panel are mostly unaffected by the errors along the VLBI signal path. The synthetic data are averaged over VLBI scan durations. For most Stokes ℐ and closure phase data points, the displayed thermal noise error bars are smaller than the plotted symbols. The model data is shown with a black line.
Current usage metrics show cumulative count of Article Views (full-text article views including HTML views, PDF and ePub downloads, according to the available data) and Abstracts Views on Vision4Press platform.
Data correspond to usage on the plateform after 2015. The current usage metrics is available 48-96 hours after online publication and is updated daily on week days.
Initial download of the metrics may take a while.