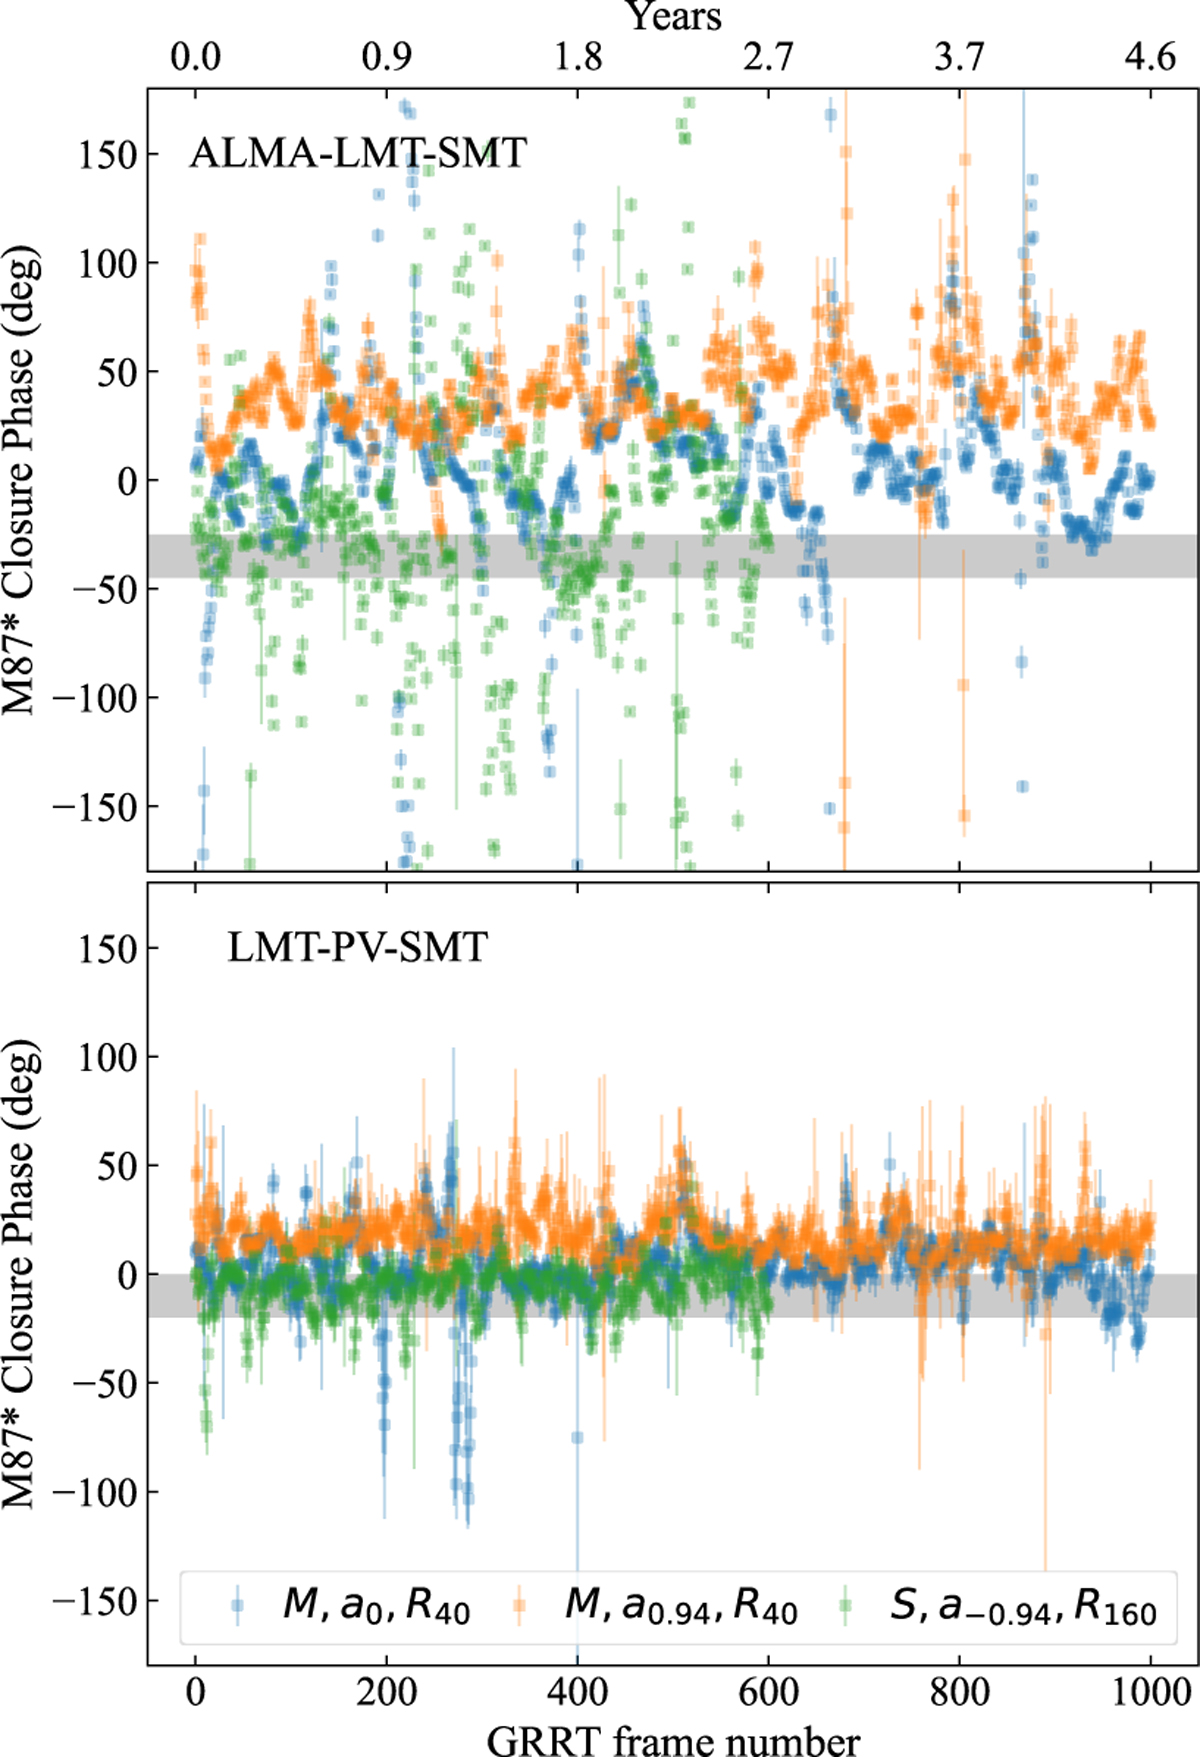
Fig. 6
Download original image
Total intensity closure phase evolution of M87* synthetic data from example MAD (M) and SANE (S) standard models as a function of model variability for the ALMA-LMT-SMT and LMT-PV-SMT triangles, respectively. Spin a* = s and Rhigh = r parameters are listed in a shorthand notation as as and Rr in the legend of the bottom panel. Each data point corresponds to a VLBI scan-averaged synthetic data closure phase measured at 02:27 UT on 11 April 2017 and the standard deviations plotted are computed from multiple synthetic data realizations of the same model frame. The corresponding measurement range from the 2017 observational data is depicted with a gray band. The SANE model shown here has been ray-traced for 600 frames only.
Current usage metrics show cumulative count of Article Views (full-text article views including HTML views, PDF and ePub downloads, according to the available data) and Abstracts Views on Vision4Press platform.
Data correspond to usage on the plateform after 2015. The current usage metrics is available 48-96 hours after online publication and is updated daily on week days.
Initial download of the metrics may take a while.