Fig. 2
Download original image
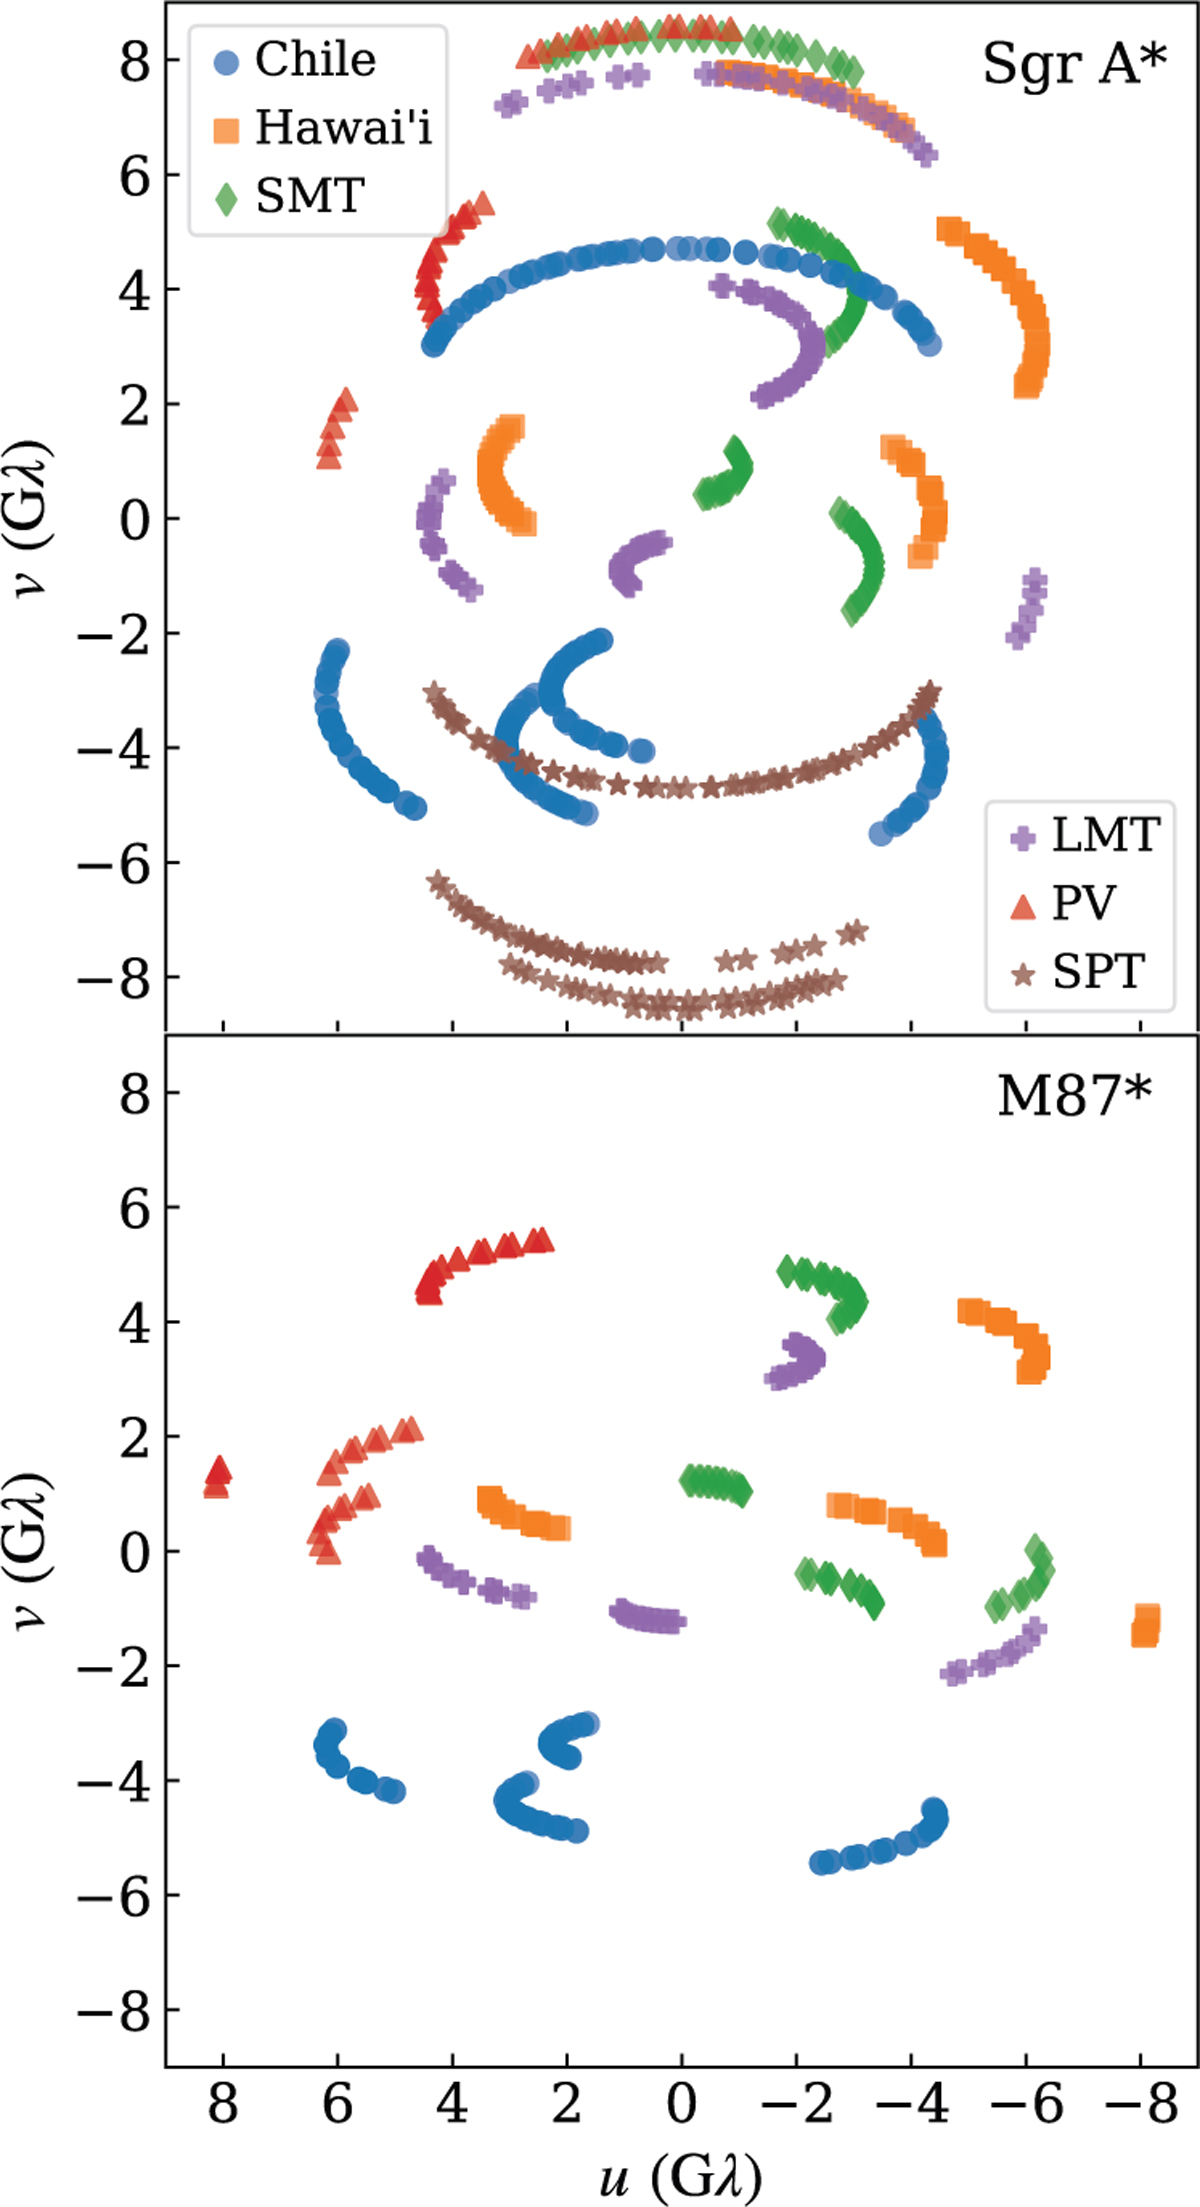
Baseline coverage of the 7 April Sgr A* (top) and 11 April 2017 M87* (bottom) 226.1–228.1 GHz EHT data processed with RPICARD. The Chile and Hawai’i markers encompass baselines to the co-located ALMA–APEX and JCMT–SMA stations, respectively. The data are averaged over VLBI scan durations and over all frequency channels here and the zero-spacings between co-located sites are not plotted. Conjugate baseline pairs (1–2 and 2–1) are displayed differently following the legends shown in the upper panel.
Current usage metrics show cumulative count of Article Views (full-text article views including HTML views, PDF and ePub downloads, according to the available data) and Abstracts Views on Vision4Press platform.
Data correspond to usage on the plateform after 2015. The current usage metrics is available 48-96 hours after online publication and is updated daily on week days.
Initial download of the metrics may take a while.