Fig. 1
Download original image
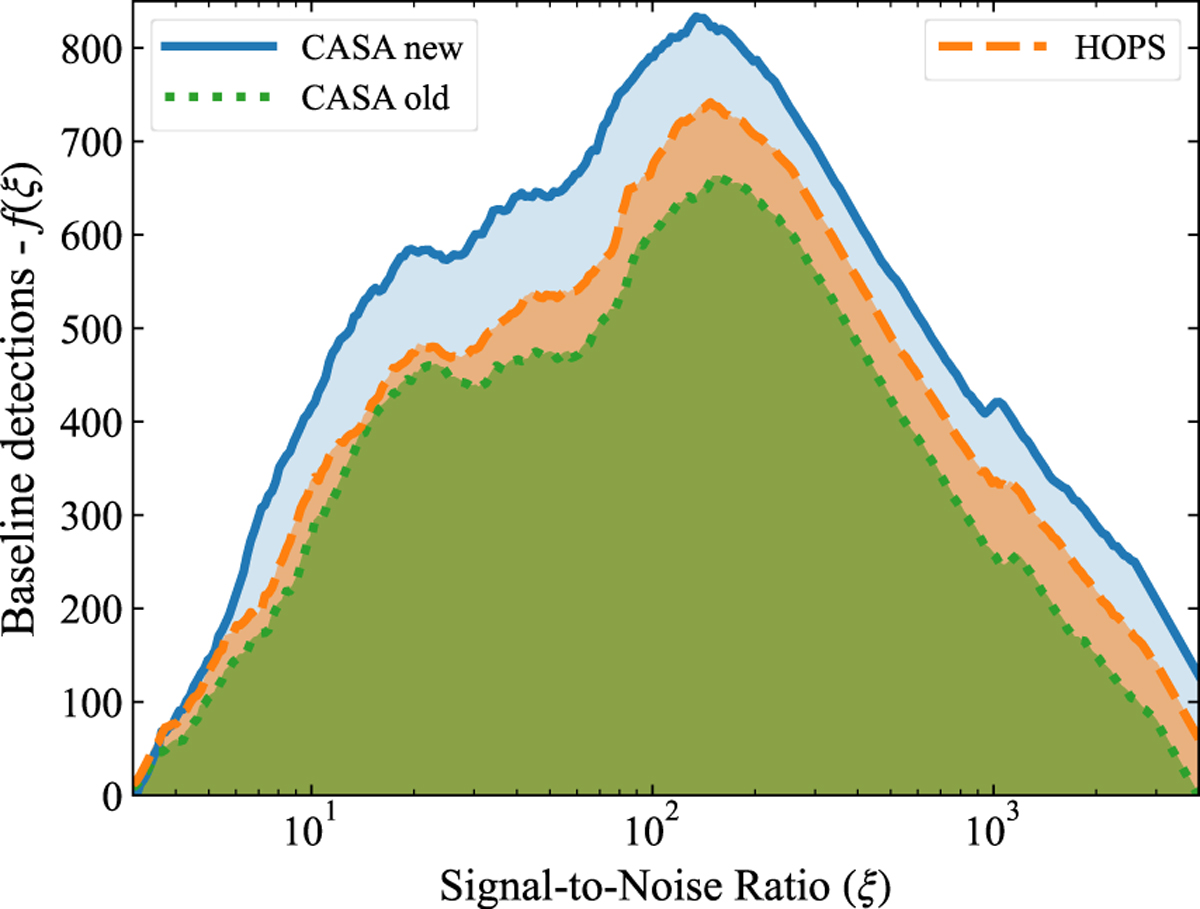
Comparison of the accumulative number of detections of the 226.1–228.1 GHz EHT data of Sgr A* from 7 April 2017 and M87* data from 11 April 2017 from different data reductions. The visibilities are averaged into a single frequency channel and time-averaged into 120 s bins. The signal-to-noise ratio (ξ) is computed from the total intensity data (averaged parallel-hand correlation products after the polarization calibration). Only data with ξ > 3 are considered as detections, which are counted on all baselines. The detections are plotted as cumulative distributions minus the function f (ξ) = 280 log (ξ) − 305.
Current usage metrics show cumulative count of Article Views (full-text article views including HTML views, PDF and ePub downloads, according to the available data) and Abstracts Views on Vision4Press platform.
Data correspond to usage on the plateform after 2015. The current usage metrics is available 48-96 hours after online publication and is updated daily on week days.
Initial download of the metrics may take a while.