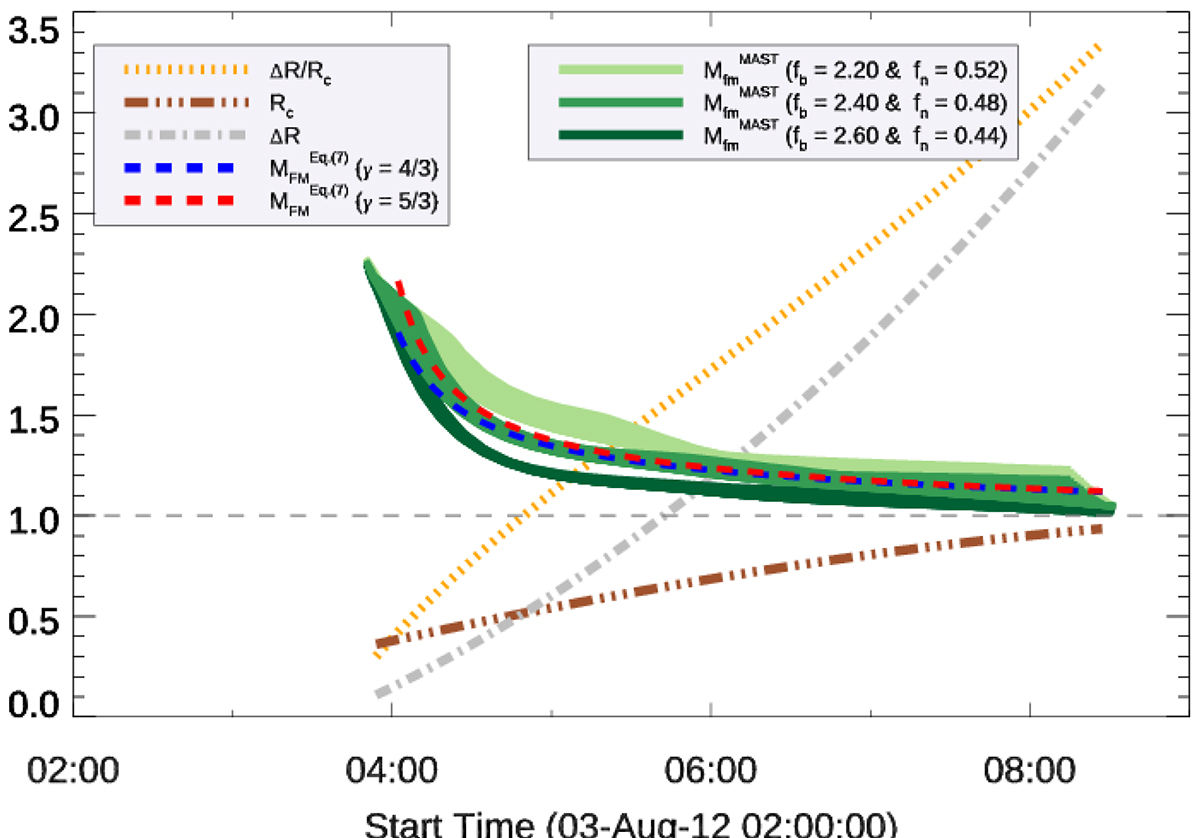
Fig. 6.
Download original image
Fast-mode Mach number Mfm as a function of time calculated using Eq. (7) for γ = 4/3 (dashed blue curve) and γ = 5/3 (dashed red curve). The shaded green bands represent Mfm values computed using MAS with the given correction factors, as the angle θBn between the wave vector and the magnetic field vector varies from 0° to 25°. The plot also shows the temporal evolution of the shock standoff distance ΔR, the effective radius of the flux rope's curvature Rc, and the ratio ΔR/Rc.
Current usage metrics show cumulative count of Article Views (full-text article views including HTML views, PDF and ePub downloads, according to the available data) and Abstracts Views on Vision4Press platform.
Data correspond to usage on the plateform after 2015. The current usage metrics is available 48-96 hours after online publication and is updated daily on week days.
Initial download of the metrics may take a while.