Fig. 5.
Download original image
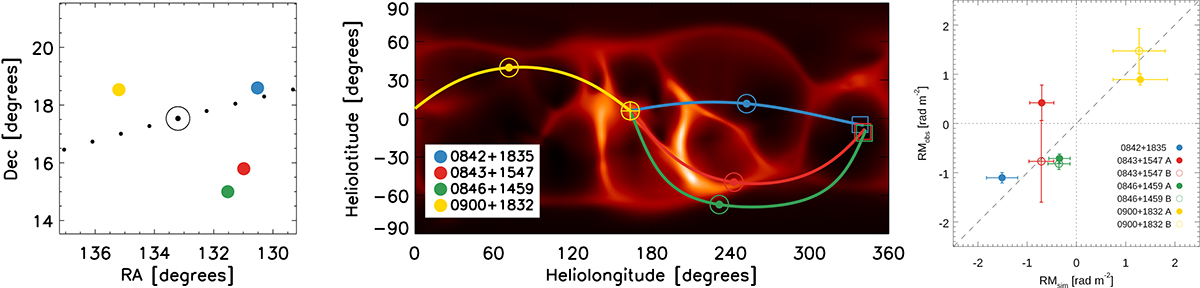
Left panel: Location of the Sun on August 2, 2012, at 16:00 UT, as indicated by the bull's-eye. The colored points mark the positions of the radio sources. The dotted line marks the ecliptic. Middle panel: The synoptic map of the electron density is shown at 10.8 R⊙ for CR 2126, as calculated by the MAS model. The curved lines represent the ray paths of the Faraday RM from four radio sources at 16:00 UT, projected onto their points of closest approach to the Sun. The bull's-eyes mark the closest approach points; the crossed circle indicates the position of Earth; and the square represents the projected location of the radio source. Right panel: Comparison of model-predicted and observed RMs. The dashed line represents perfect agreement. The product of the MHD MAS model's electron densities and magnetic field intensities was scaled by a factor of 1.15 to match the Faraday rotation observations performed on August 2, 2012.
Current usage metrics show cumulative count of Article Views (full-text article views including HTML views, PDF and ePub downloads, according to the available data) and Abstracts Views on Vision4Press platform.
Data correspond to usage on the plateform after 2015. The current usage metrics is available 48-96 hours after online publication and is updated daily on week days.
Initial download of the metrics may take a while.