Fig. 4.
Download original image
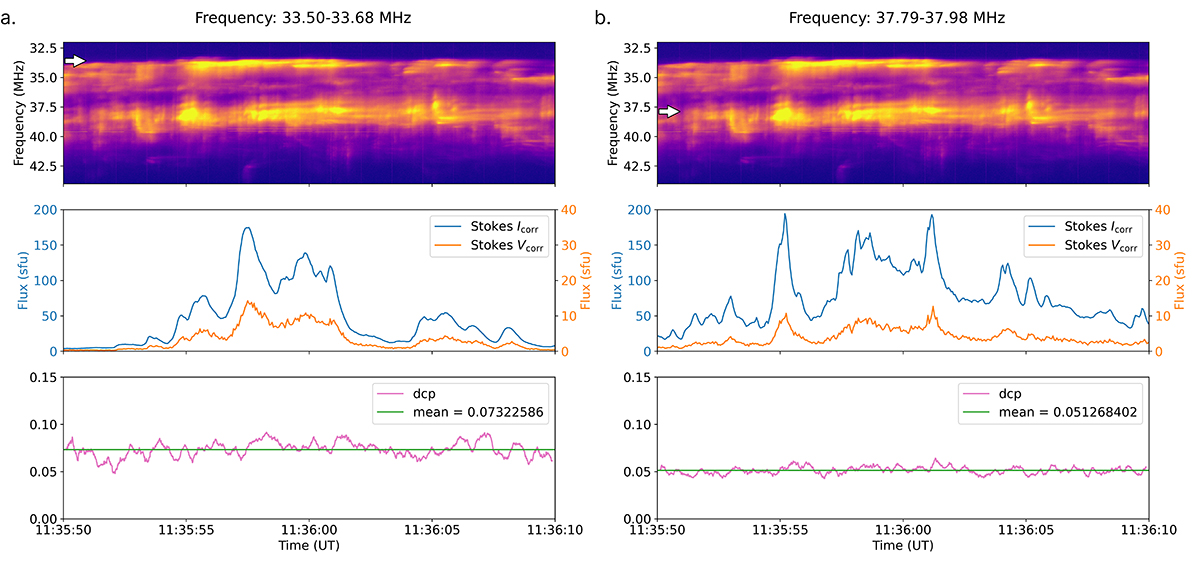
Stokes I and V flux densities together with the dcp time series at 33.6 MHz (a) and at 37.9 MHz (b). The top panels in (a) and (b) show the dynamic spectrum at 11:35:50–11:36:10 UT in the range of 32−44 MHz. The white arrows indicate the frequencies of the used sub-bands. The middle panels show the time series of the corrected Stokes I (blue) and V (orange) flux densities. The flux densities are averaged over 0.05 s. The bottom panels show the time series of the dcp (pink) and its mean value (green). The dcp time series has been smoothed using the centred moving average method (window size: 21).
Current usage metrics show cumulative count of Article Views (full-text article views including HTML views, PDF and ePub downloads, according to the available data) and Abstracts Views on Vision4Press platform.
Data correspond to usage on the plateform after 2015. The current usage metrics is available 48-96 hours after online publication and is updated daily on week days.
Initial download of the metrics may take a while.