Fig. 3.
Download original image
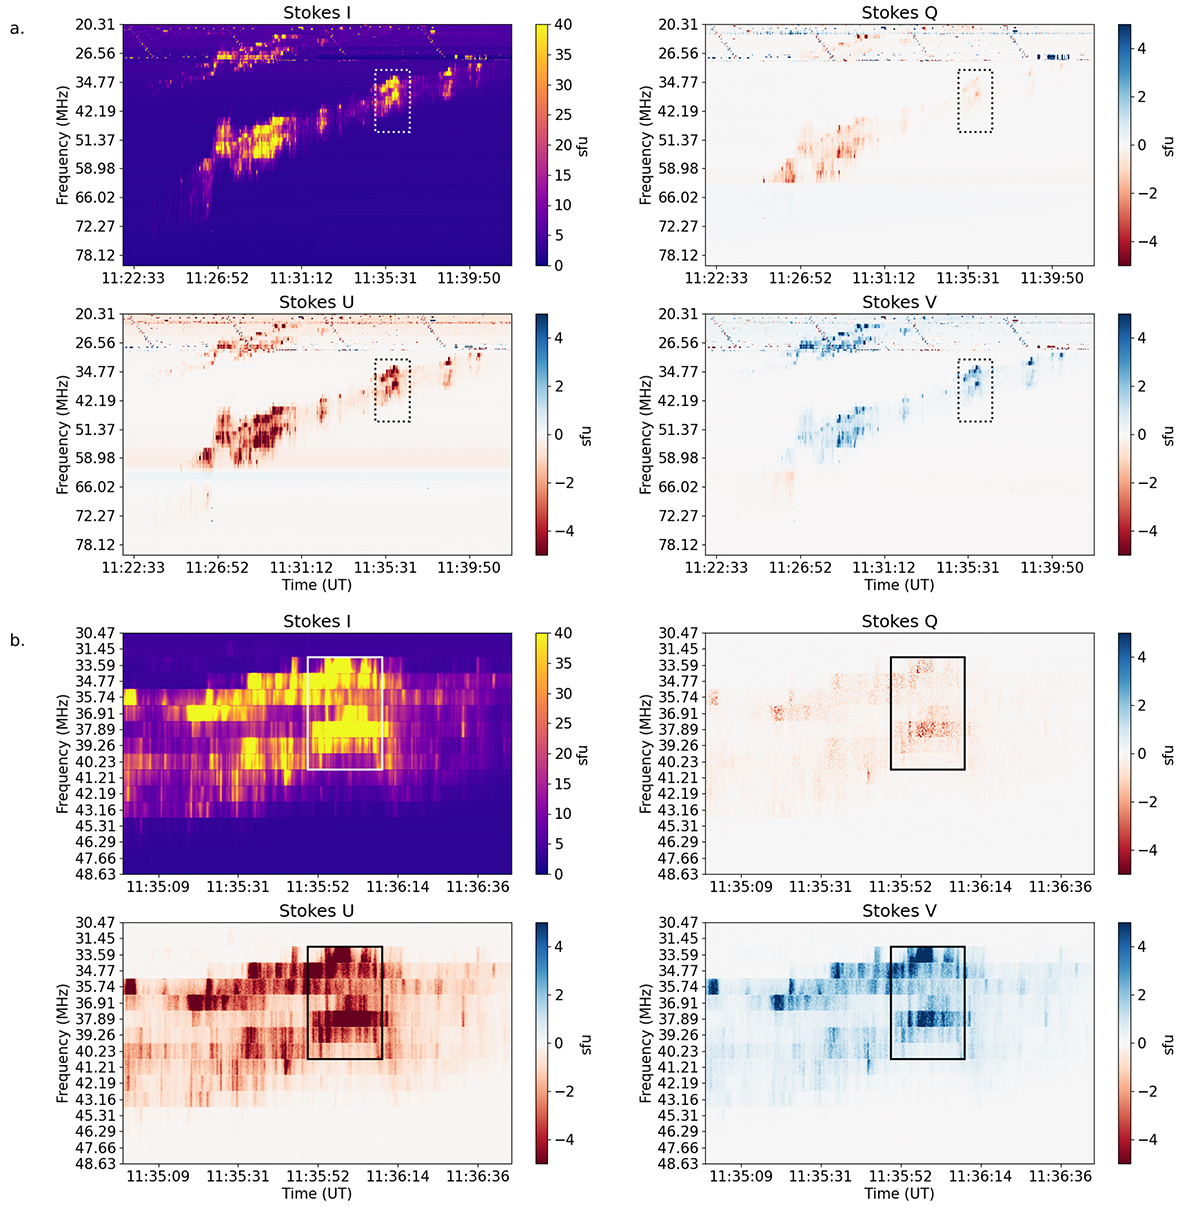
Full Stokes dynamic spectra of the type II burst observed by LOFAR. In both (a) and (b), the Stokes I (top left), U (bottom left), Q (top right), and V (bottom right) are displayed. (a) Dynamic spectrum in the range of approximately 20−80 MHz at 11:22–11:42 UT. The dashed rectangle in each panel outlines the part of the spectra shown in (b). (b) Zoomed-in parts of the dynamic spectra in the range at 11:35:00–11:36:45 UT. The rectangles in each panel outline the part of the spectrum with the highest amount of the Stokes V signal and the least leaked signal in Stokes Q.
Current usage metrics show cumulative count of Article Views (full-text article views including HTML views, PDF and ePub downloads, according to the available data) and Abstracts Views on Vision4Press platform.
Data correspond to usage on the plateform after 2015. The current usage metrics is available 48-96 hours after online publication and is updated daily on week days.
Initial download of the metrics may take a while.