Fig. 2.

Download original image
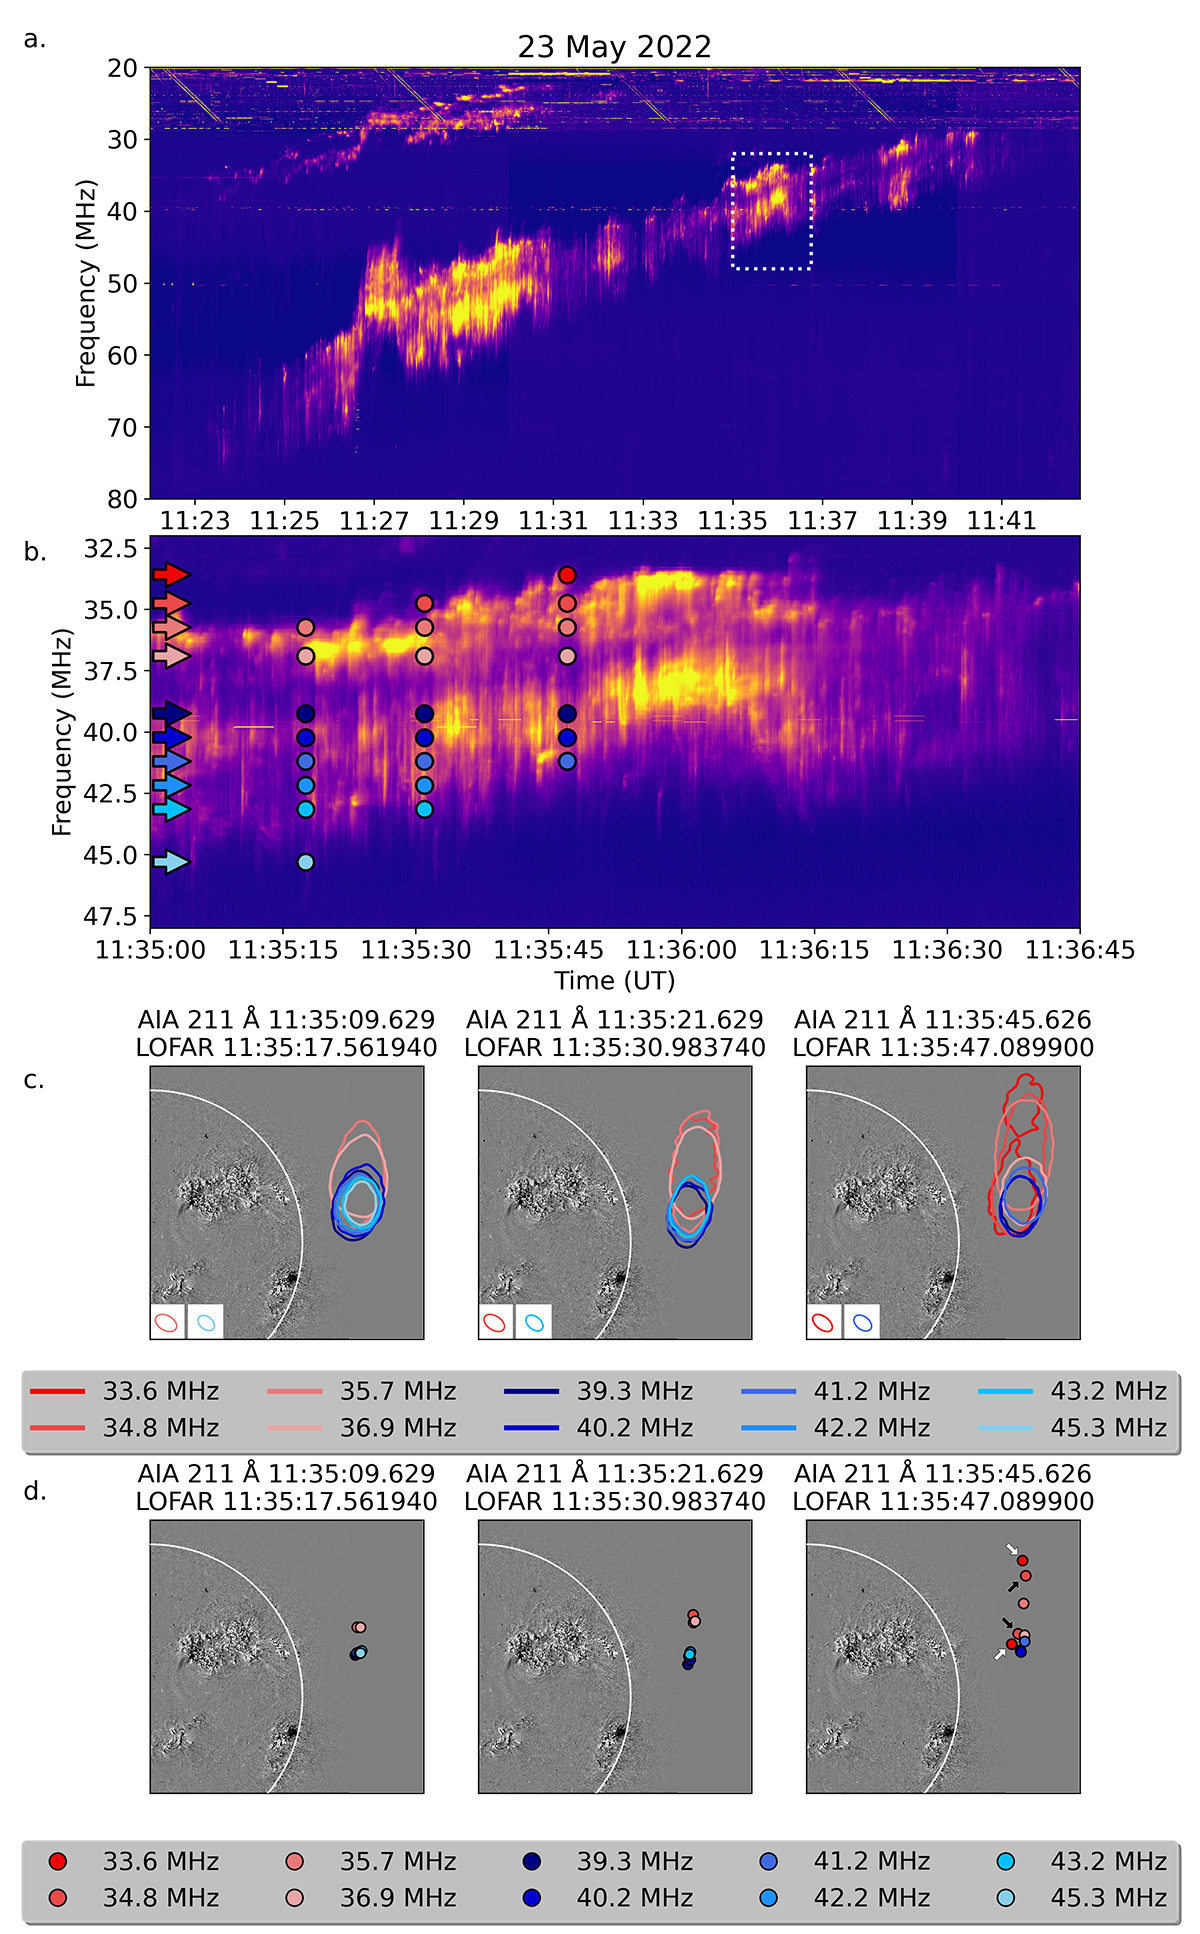
Dynamic spectra and imaging of the type II solar radio burst observed by LOFAR on 23 May 2022. (a) Full dynamic spectrum of the type II burst between 20 MHz and 80 MHz at 11:22–11:42 UT. (b) Zoom-in of the spectrum outlined by a white dotted rectangle in (a). The coloured arrows indicate the central frequencies of the sub-bands used for the imaging. The coloured dots correspond to the three different time steps chosen for showing the imaging of the radio sources. (c) Contours of the radio sources overlaid on SDO/AIA 211 Å running difference images. The contours were extracted from LOFAR imaging at ∼11:35:18 (left), ∼11:35:31 (middle), and ∼11:35:47 (right) UT. The times and colours correspond to the dots in (b). The temporal evolution of the radio contours between 11:35:00 and 11:36:45 UT is shown in Movie 3 (available online). (d) Centroids of the radio sources at the same frequencies and times as in (c). In the right panel, two sets of centroids were extracted for two frequencies and are indicated by white (33.6 MHz) and black (34.8 MHz) arrows.
Current usage metrics show cumulative count of Article Views (full-text article views including HTML views, PDF and ePub downloads, according to the available data) and Abstracts Views on Vision4Press platform.
Data correspond to usage on the plateform after 2015. The current usage metrics is available 48-96 hours after online publication and is updated daily on week days.
Initial download of the metrics may take a while.


