Fig. 8.
Download original image
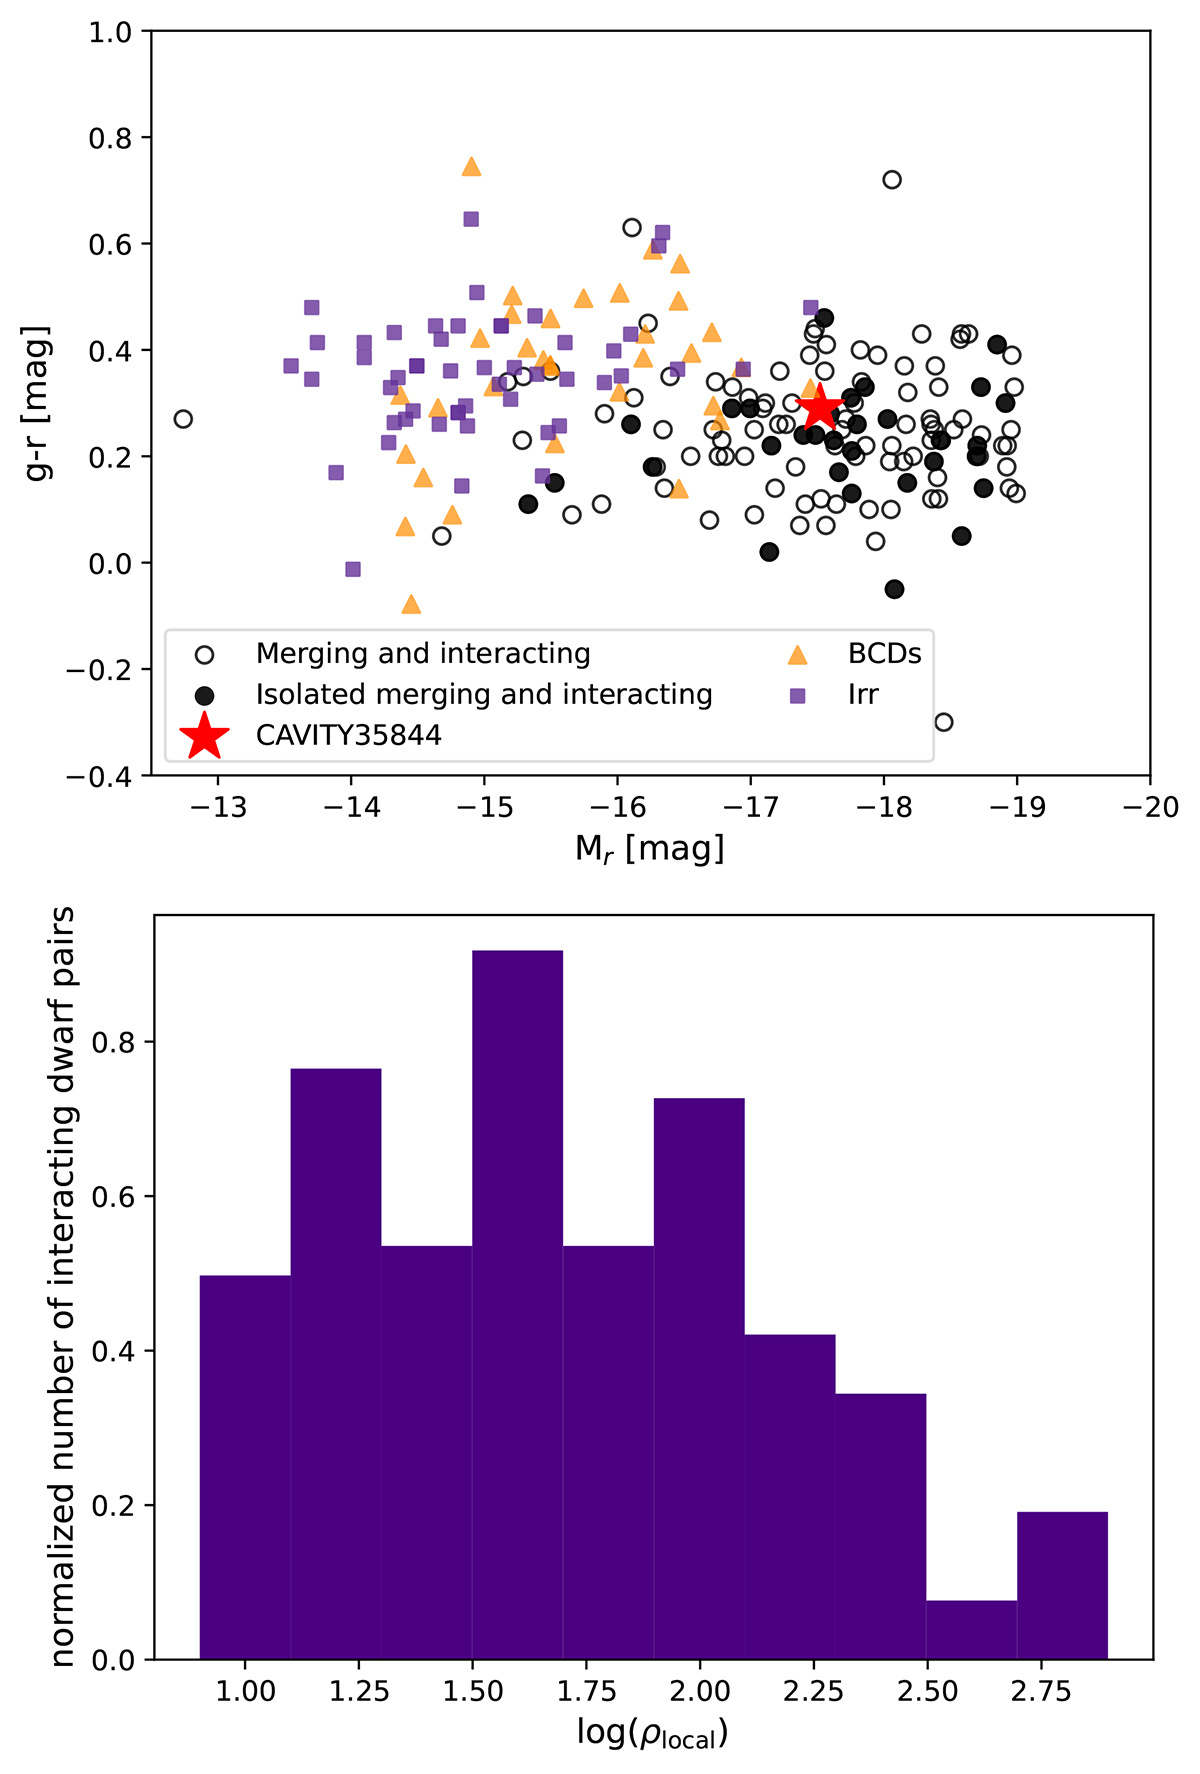
Comparison with other merging systems. Top panel: Comparison of the g-r colour of interacting or merging dwarf galaxies from the Paudel et al. (2018) sample (shown with filled and empty black circle symbols for isolated and non-isolated cases, respectively) with the interacting system (shown as red data point), the Lisker et al. (2006) sample of BCDs (orange triangles), and the Pak et al. (2014) sample of irregular dwarf galaxies (shown in purple squares). Bottom panel: Distribution of normalised projected number density shown for the galaxies in the Paudel et al. (2018) sample with more than three neighbours. The local density was computed as the number of neighbours found within a projected distance of 1.5 Mpc and a relative radial velocity of ΔV = 500 km s−1 divided by the volume.
Current usage metrics show cumulative count of Article Views (full-text article views including HTML views, PDF and ePub downloads, according to the available data) and Abstracts Views on Vision4Press platform.
Data correspond to usage on the plateform after 2015. The current usage metrics is available 48-96 hours after online publication and is updated daily on week days.
Initial download of the metrics may take a while.