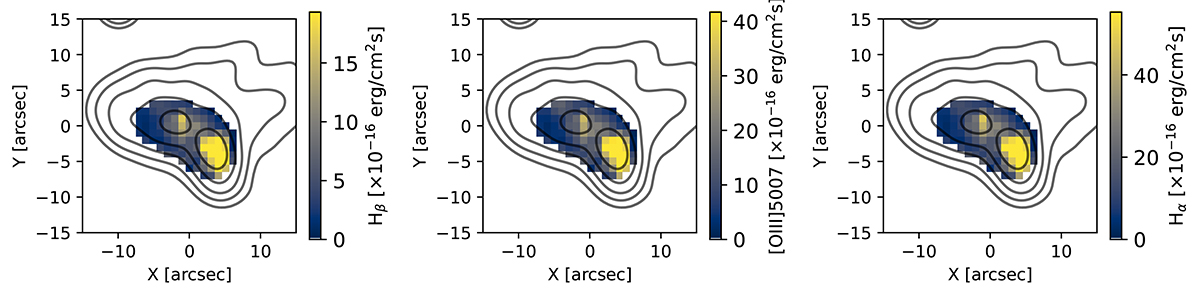
Fig. 5.
Download original image
Emission line maps. From left to right, maps of Hβ, [OIII]λ5007, and Hα fluxes. All the emission lines shown here are corrected for optical dust attenuation, and contours are the same as in Fig. 2. In all maps, only spaxels with S/N > 15 are shown where we considered the same S/N definition, computed in the wavelength range from 4590 to 4610 Å.
Current usage metrics show cumulative count of Article Views (full-text article views including HTML views, PDF and ePub downloads, according to the available data) and Abstracts Views on Vision4Press platform.
Data correspond to usage on the plateform after 2015. The current usage metrics is available 48-96 hours after online publication and is updated daily on week days.
Initial download of the metrics may take a while.