Fig. 4.
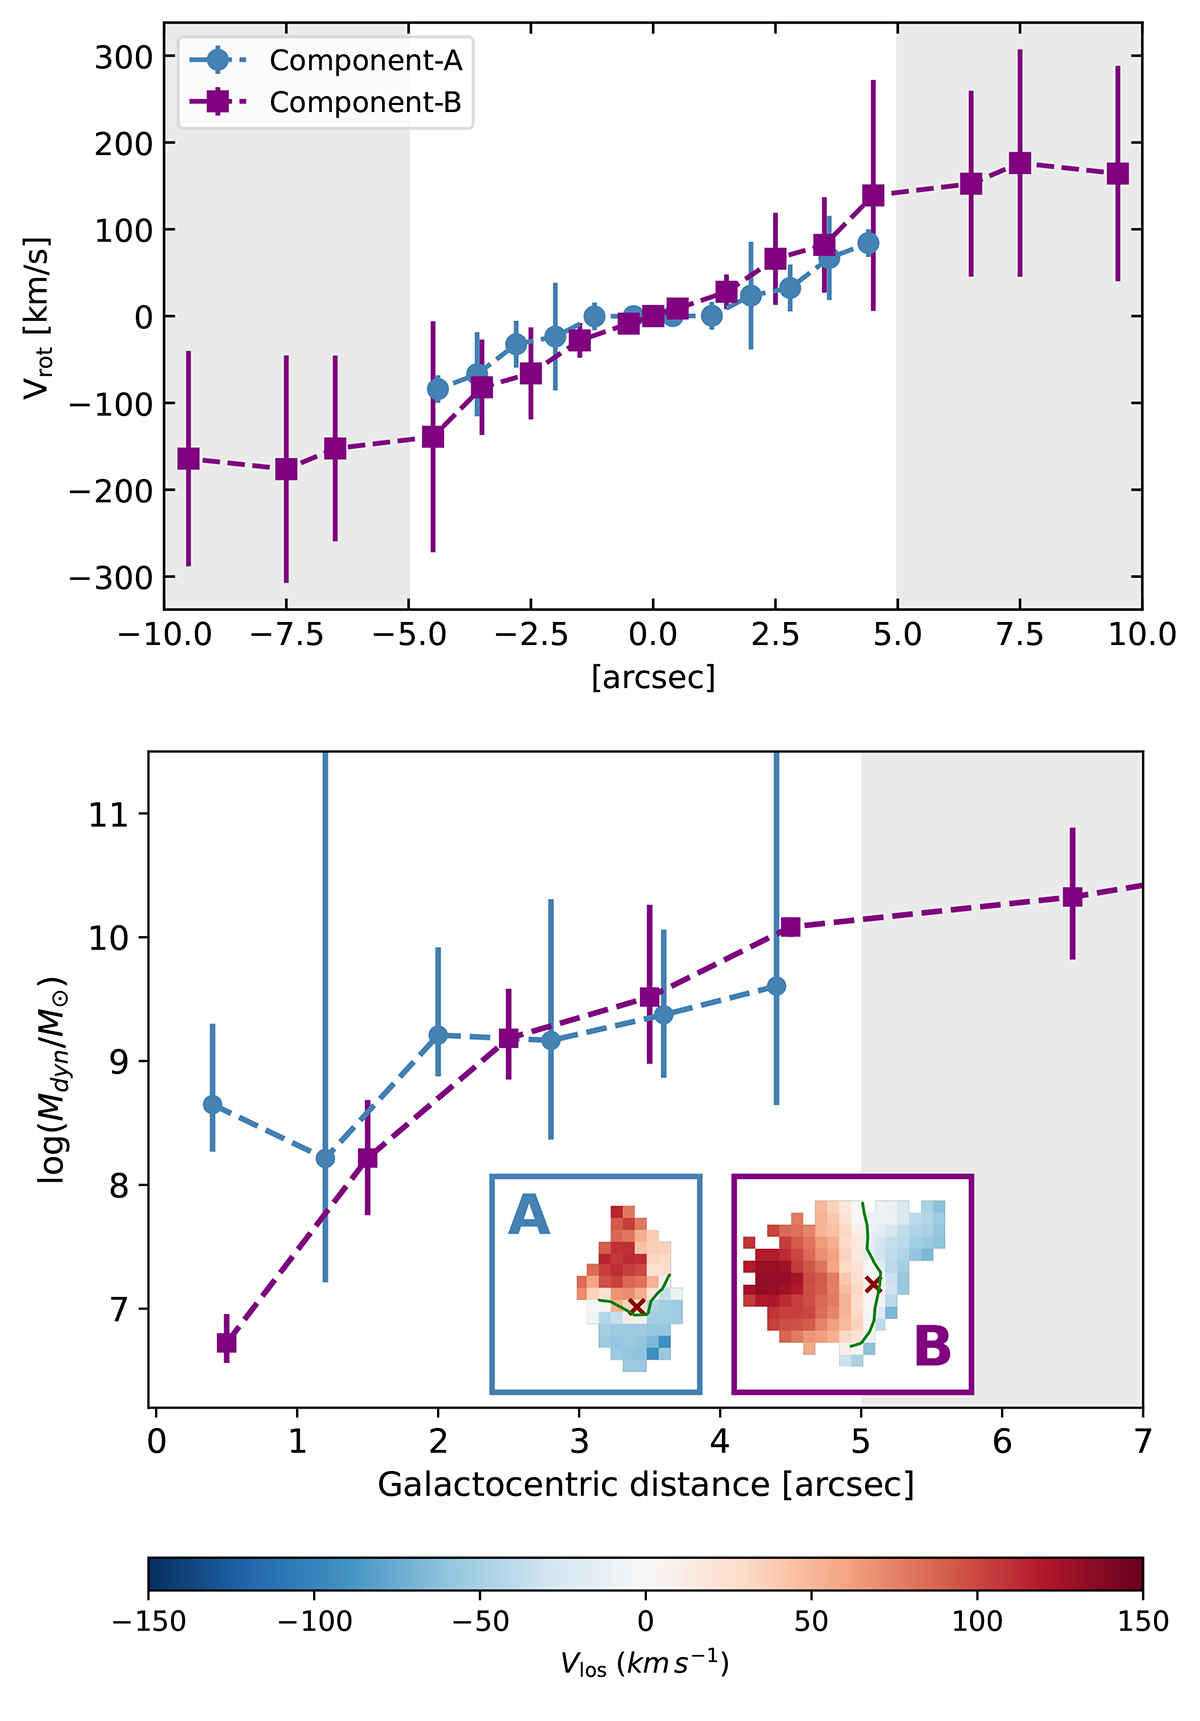
Download original image
Rotating disks in the merging dwarfs. Top panel: Rotational velocity of each separated component derived using. Both components show a similar radial gradient of rotational velocity by tracing the Hα emission line. We note that results beyond ∼5 arcsec are excluded from our discussion as they are derived from fits over spaxels with S/N < 15. Bottom panel: Enclosed dynamical mass of each component calculated at a given radius using the rotation curves estimated by 3DBAROLO, assuming spherical symmetry. Each mass is the enclosed at a given radius. The rotational velocity map of each component is shown inside boxes. In each map, the assumed kinematical centre of the galaxies is marked. The green line represents the Vrot = 0 km s−1 isoline of each velocity map.
Current usage metrics show cumulative count of Article Views (full-text article views including HTML views, PDF and ePub downloads, according to the available data) and Abstracts Views on Vision4Press platform.
Data correspond to usage on the plateform after 2015. The current usage metrics is available 48-96 hours after online publication and is updated daily on week days.
Initial download of the metrics may take a while.