Fig. 2.
Download original image
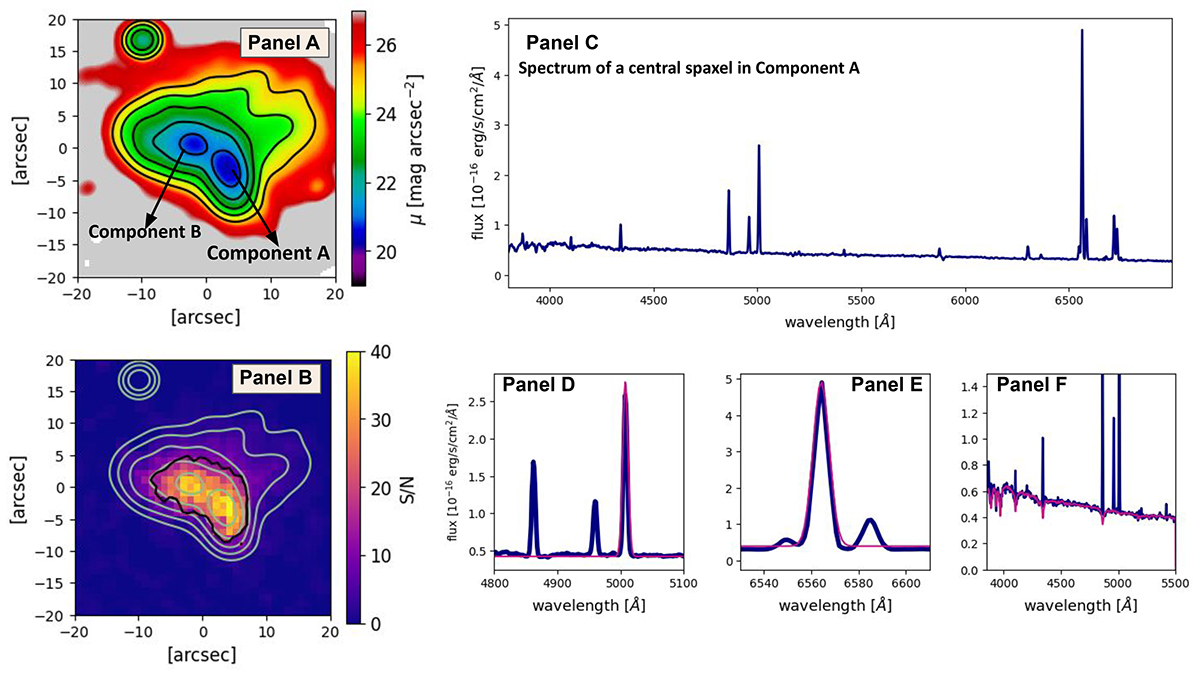
Observed IFU data. Panel A: g-band surface brightness map of CAVITY35843 and 35844, same as panel D of Fig. 1 but convolved to match the pixel scale of PPAK IFU data. Panel B: Signal-to-noise map of the PPAK data with the same contours as in Panel A. The black contour marks the S/N = 15. Panel C: Example of PPAK spectrum, in the rest frame, from a central spaxel in component A. Panels D and E: Examples of single-line Gaussian fits for [OIII]λ5007 and Hα emission lines, respectively. The best fit is shown in pink. Panel F: Fit over the stellar continuum of the same spectrum shown in Panel C using pPXF (see Sect. 3 for details).
Current usage metrics show cumulative count of Article Views (full-text article views including HTML views, PDF and ePub downloads, according to the available data) and Abstracts Views on Vision4Press platform.
Data correspond to usage on the plateform after 2015. The current usage metrics is available 48-96 hours after online publication and is updated daily on week days.
Initial download of the metrics may take a while.