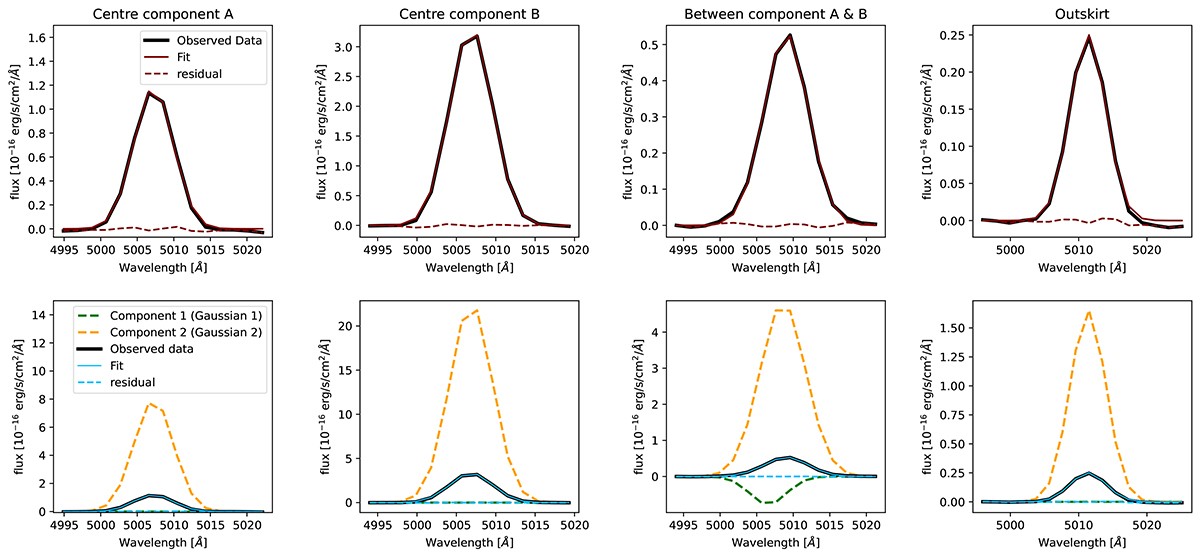
Fig. A.2.
Download original image
Examples of fits for the [OIII]λ5007 emission line shown for four distinct regions, arranged from left to right: component A, component B, the region between the two components, and the outskirts of the merging pair. The top row illustrates single Gaussian fits, while the bottom row showcases examples of double Gaussian fits.
Current usage metrics show cumulative count of Article Views (full-text article views including HTML views, PDF and ePub downloads, according to the available data) and Abstracts Views on Vision4Press platform.
Data correspond to usage on the plateform after 2015. The current usage metrics is available 48-96 hours after online publication and is updated daily on week days.
Initial download of the metrics may take a while.