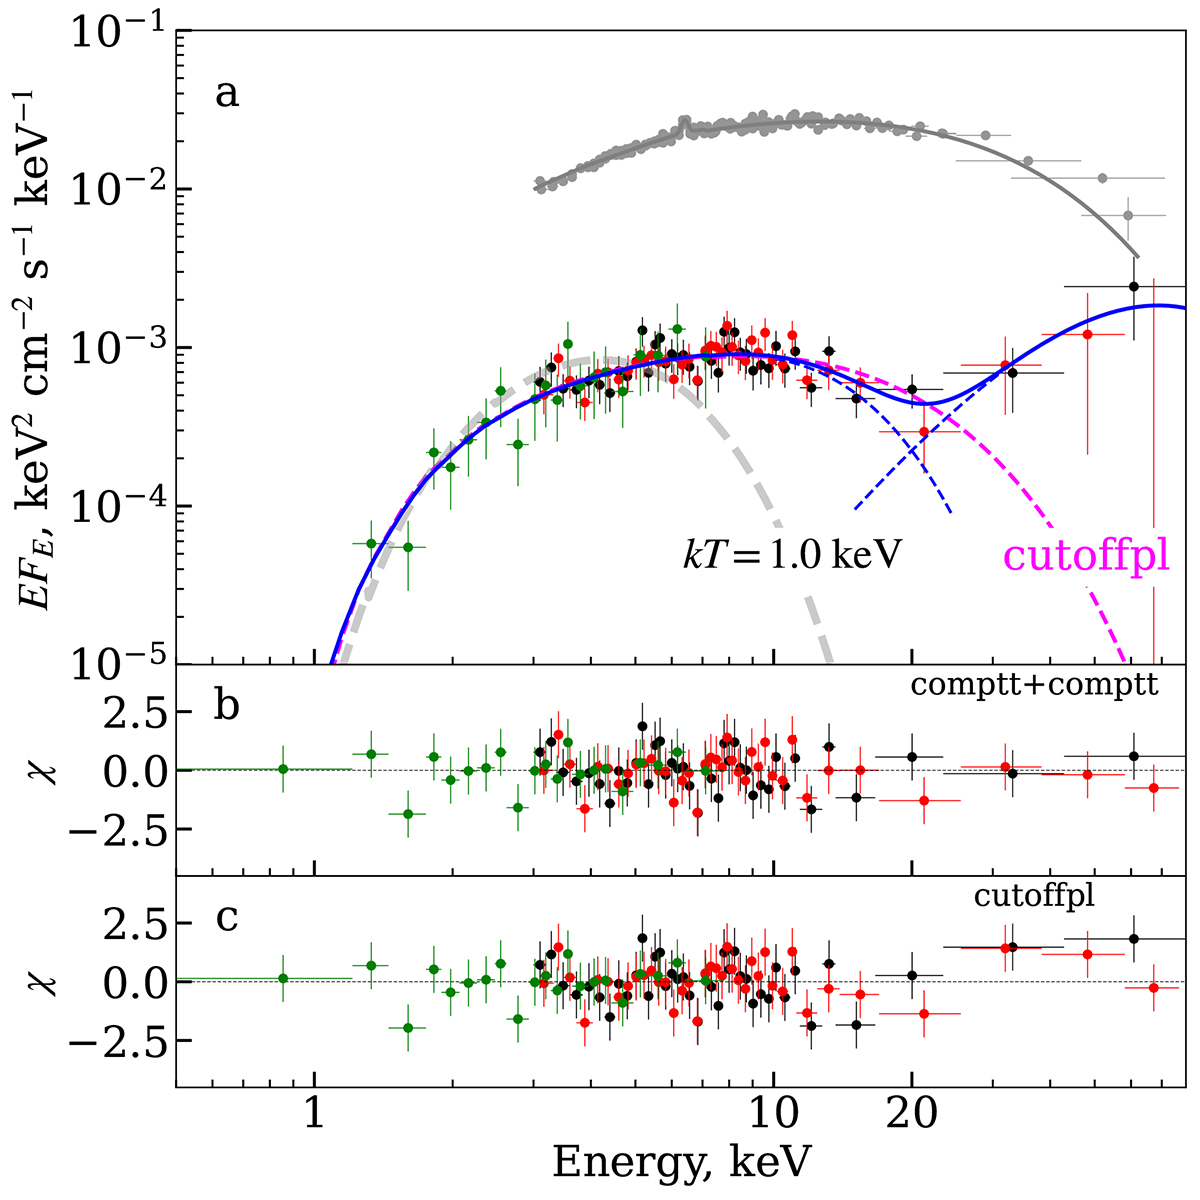
Fig. 4.
Download original image
Unfolded spectrum of J1301. Red and black dots are for the FPMA and FPMB telescopes of the NuSTAR observatory (NuSTAR2024), green for the Swift/XRT telescope. Gray dots represent NuSTAR2014 observation (Krivonos et al. 2015). The solid blue line in panel a shows the comptt+comptt spectral model, while the dashed blue lines represent the two components separately. The dashed magenta line shows the best fit with the absorbed cutoff power-law model. A blackbody model with temperature T = 1.0 keV is plotted as a dashed gray line for visual comparison. Panels b and c show the residuals for the comptt+comptt and cutoffpl continuum models, respectively.
Current usage metrics show cumulative count of Article Views (full-text article views including HTML views, PDF and ePub downloads, according to the available data) and Abstracts Views on Vision4Press platform.
Data correspond to usage on the plateform after 2015. The current usage metrics is available 48-96 hours after online publication and is updated daily on week days.
Initial download of the metrics may take a while.