Open Access
Fig. 3.
Download original image
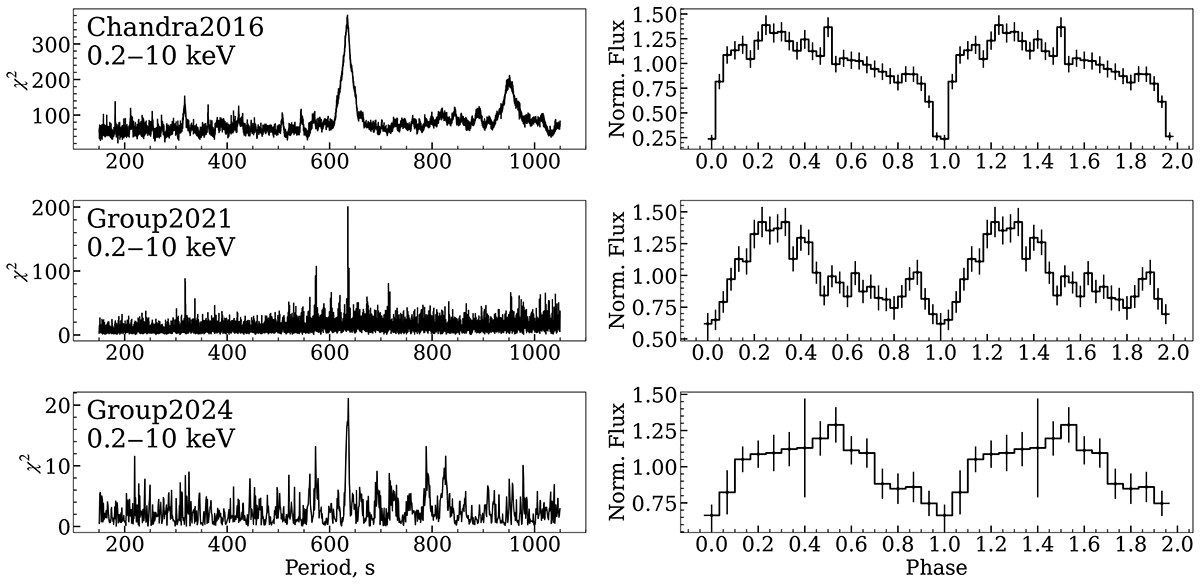
Left: χ2 periodograms for Chandra2016 (top panel), Group2021 (middle panel), and Group2024 (bottom panel). Right: Normalized pulse profiles of J1301 for the corresponding intervals (see Sect. 3.2).
Current usage metrics show cumulative count of Article Views (full-text article views including HTML views, PDF and ePub downloads, according to the available data) and Abstracts Views on Vision4Press platform.
Data correspond to usage on the plateform after 2015. The current usage metrics is available 48-96 hours after online publication and is updated daily on week days.
Initial download of the metrics may take a while.