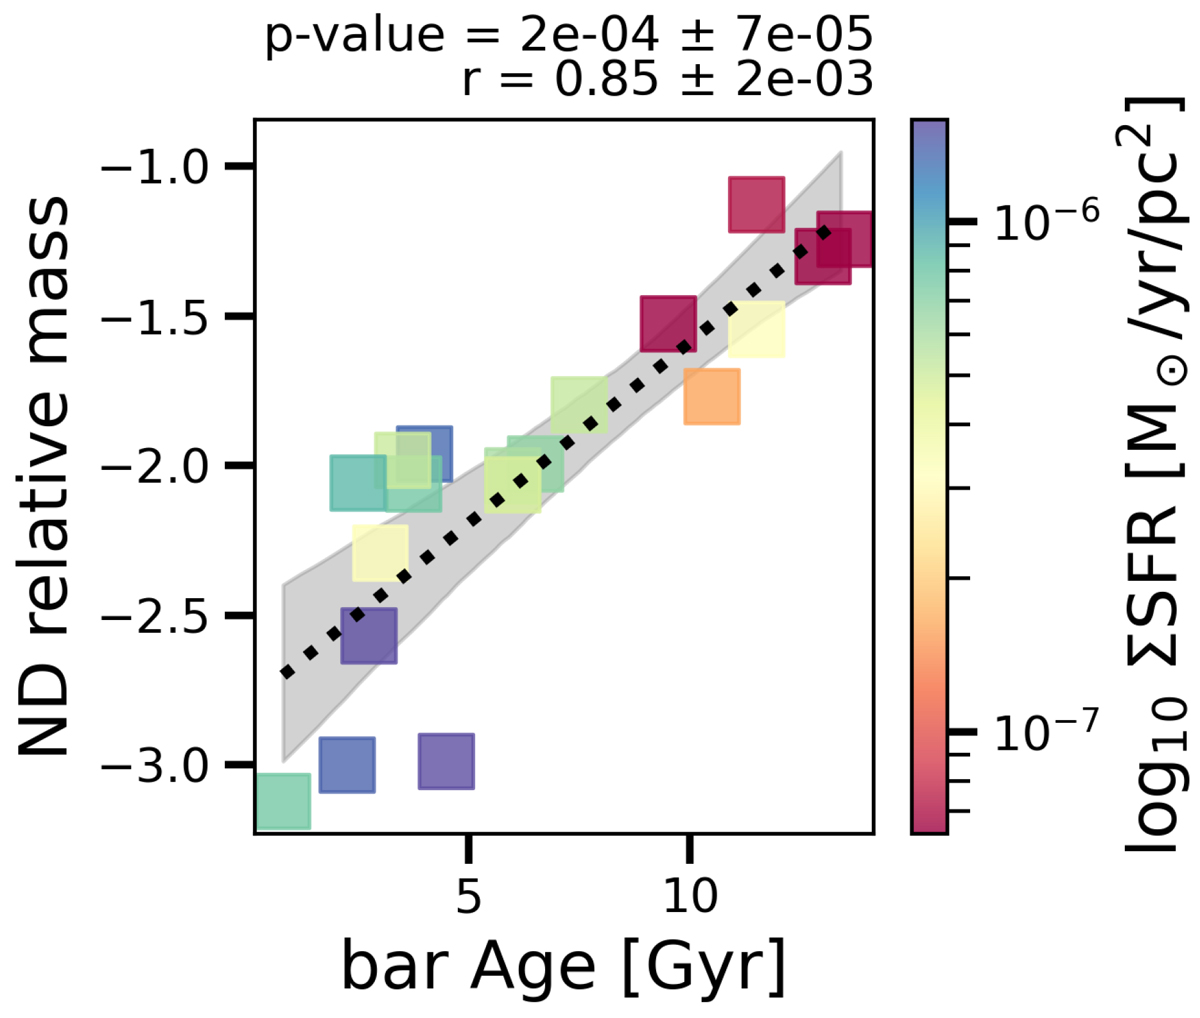
Fig. 9.
Download original image
Nuclear disc mass build-up. In this plot we present the nuclear disc mass normalised by the galaxy mass for different bar ages. To measure the nuclear disc mass, we integrated the isolated SFH (blue dashed curves in Figs. B.1 and B.2), following the same approach in de Sá-Freitas et al. (2023a, b). Additionally, we color-coded each point according to its ΣSFR, which increases towards blue. It is clear that young nuclear discs are less massive with a higher star formation rate. As the bars age, the nuclear discs gradually present less star formation, while building up their mass. Lastly, we find a correlation coefficient of 0.85±2×10⁻³, with p-value = 2×10⁻⁴±7×10⁻⁵.
Current usage metrics show cumulative count of Article Views (full-text article views including HTML views, PDF and ePub downloads, according to the available data) and Abstracts Views on Vision4Press platform.
Data correspond to usage on the plateform after 2015. The current usage metrics is available 48-96 hours after online publication and is updated daily on week days.
Initial download of the metrics may take a while.