Fig. 7.
Download original image
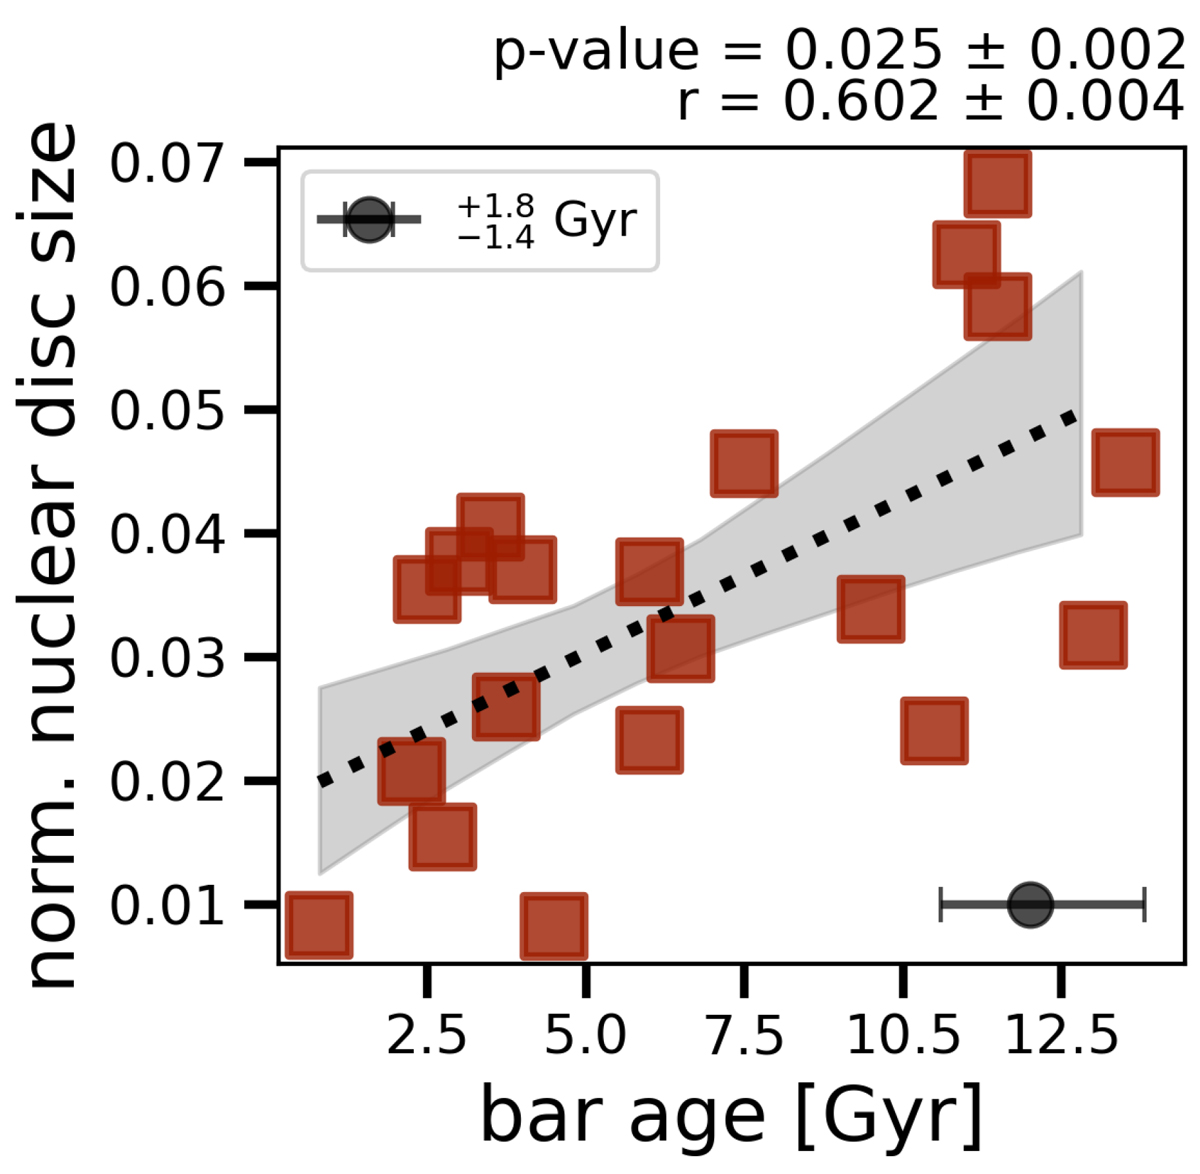
Nuclear disc size normalised by galaxy size with respect to bar ages. We present the nuclear disc size normalised by the galaxy size (see Tables 1 and 3) for different bar ages. Additionally, we display the linear regression for 1000 bootstrap repetitions, with the Pearson coefficient value of r = 0.600±0.004 and p-value = 0.029±0.003. From this result, it is clear that older bars tend to host larger nuclear discs, while younger bars have smaller ones. This is consistent with the scenario in which nuclear discs grow with time, following the inside-out evolution context proposed by Bittner et al. (2020).
Current usage metrics show cumulative count of Article Views (full-text article views including HTML views, PDF and ePub downloads, according to the available data) and Abstracts Views on Vision4Press platform.
Data correspond to usage on the plateform after 2015. The current usage metrics is available 48-96 hours after online publication and is updated daily on week days.
Initial download of the metrics may take a while.