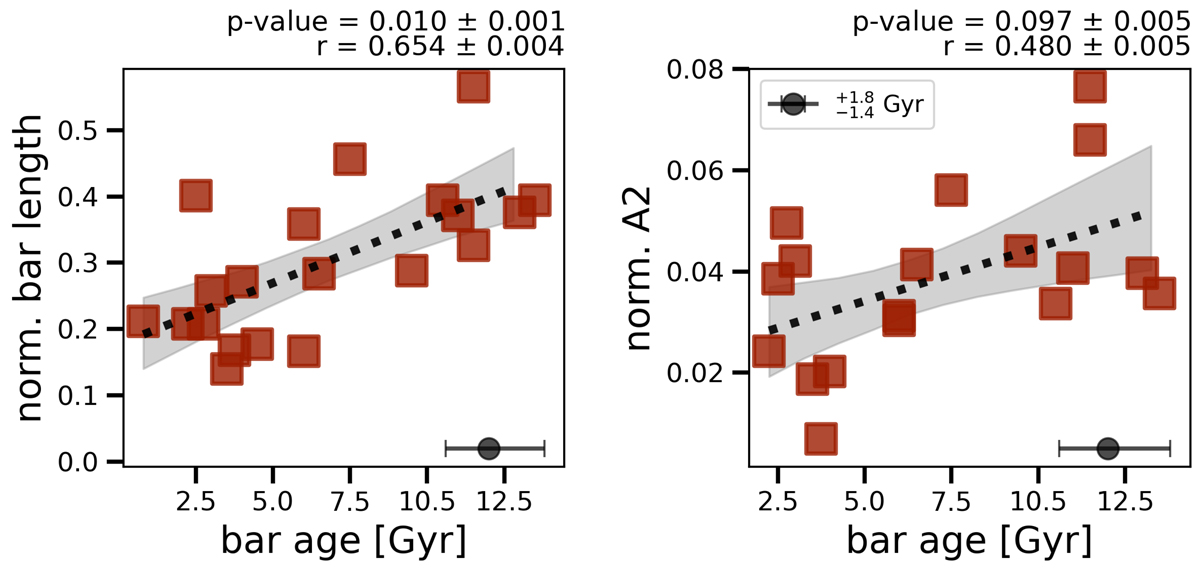
Fig. 6.

Download original image
Insights into bar ageing. We display the normalised bar lengths (left panel) and normalised bar strengths (A2- right panel) for our sample by galaxy size. We also present the linear regression (dotted black line) for 1000 bootstrap repetitions, the Pearson correlation coefficient r, and the associated null hypothesis p-value. For the two properties, we find trends of correlation. For the bar length, the associated p-value is smaller than 0.05, while for A2 its p-value is ∼1. These results are in agreement with the scenario in which older bars are longer and stronger.
Current usage metrics show cumulative count of Article Views (full-text article views including HTML views, PDF and ePub downloads, according to the available data) and Abstracts Views on Vision4Press platform.
Data correspond to usage on the plateform after 2015. The current usage metrics is available 48-96 hours after online publication and is updated daily on week days.
Initial download of the metrics may take a while.


