Fig. 3.
Download original image
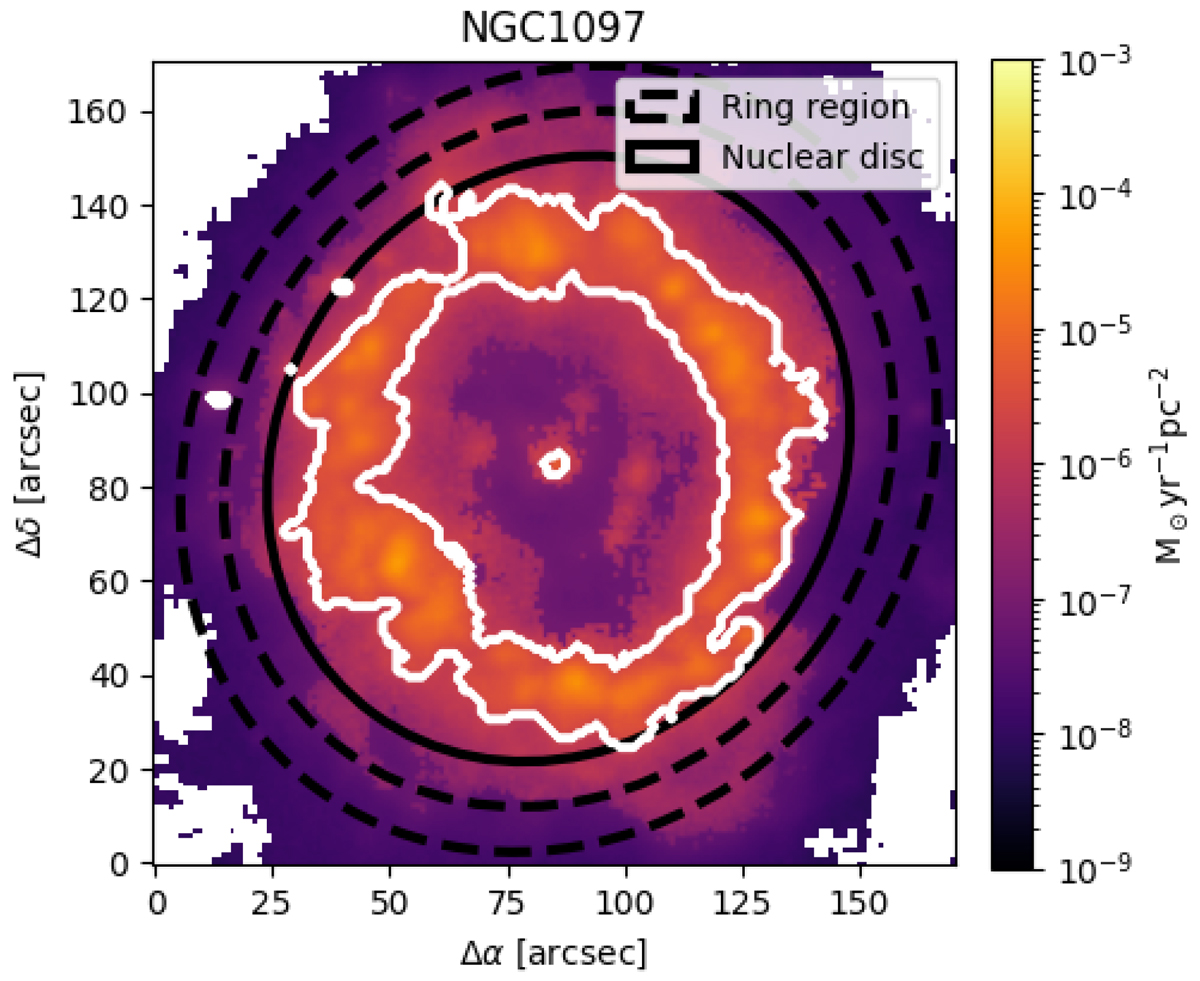
Star formation rate surface density map of NGC 1097 (ΣSFR in units of M⊙ yr−1 pc−2). We present the limits of the nuclear disc defined in this work (Table 3; solid black contour) and the ring region from which we extract the representative spectrum in dashed black contour (see illustration in Fig. 2). Additionally, we present the ΣSFR = 2×10⁶ mask (solid-white countour). The mask is limited to the star-forming ring. Since we are interested in the oldest stars that belong to the nuclear disc, masking the active star-forming regions will not affect our methodology.
Current usage metrics show cumulative count of Article Views (full-text article views including HTML views, PDF and ePub downloads, according to the available data) and Abstracts Views on Vision4Press platform.
Data correspond to usage on the plateform after 2015. The current usage metrics is available 48-96 hours after online publication and is updated daily on week days.
Initial download of the metrics may take a while.