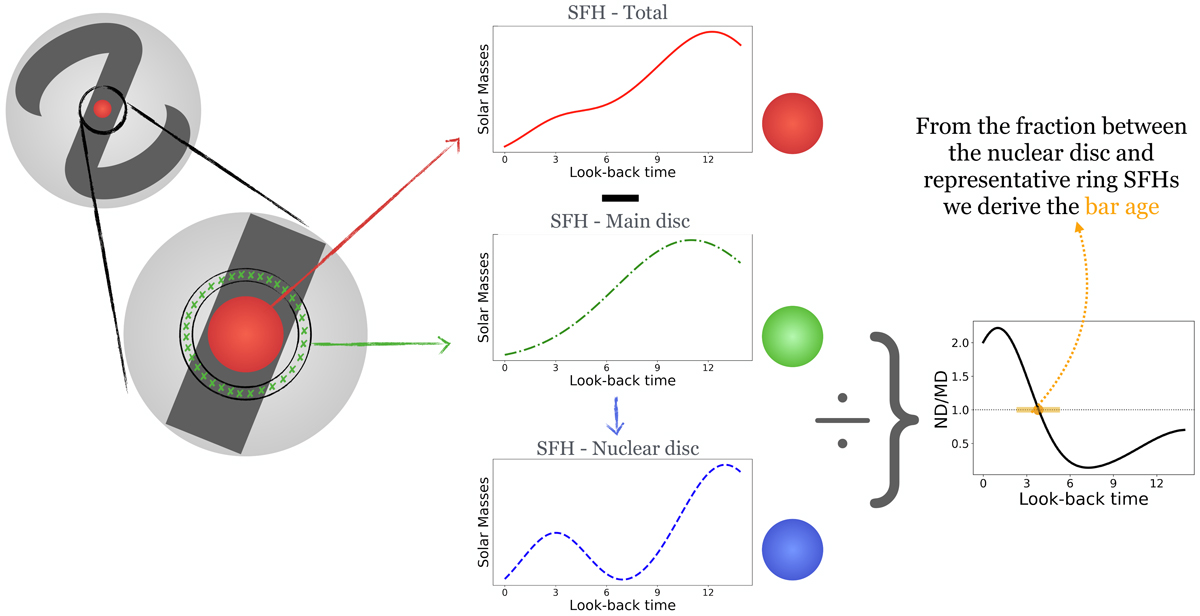
Fig. 2.
Download original image
Bar age measurement method. We illustrate the method described in Sect. 3, analogous to Fig. 2 in de Sá-Freitas et al. (2023a). We show the nuclear disc and representative ring regions, from which we derive the SFH of the original data in the nuclear disc region (red) and the representative region (green). We proceed to subtract the main disc SFH from the original one, and the difference is considered the nuclear disc SFH (blue). We then use the ratio ND/MD to time the moment of bar formation (right plot, orange).
Current usage metrics show cumulative count of Article Views (full-text article views including HTML views, PDF and ePub downloads, according to the available data) and Abstracts Views on Vision4Press platform.
Data correspond to usage on the plateform after 2015. The current usage metrics is available 48-96 hours after online publication and is updated daily on week days.
Initial download of the metrics may take a while.