Fig. 13.
Download original image
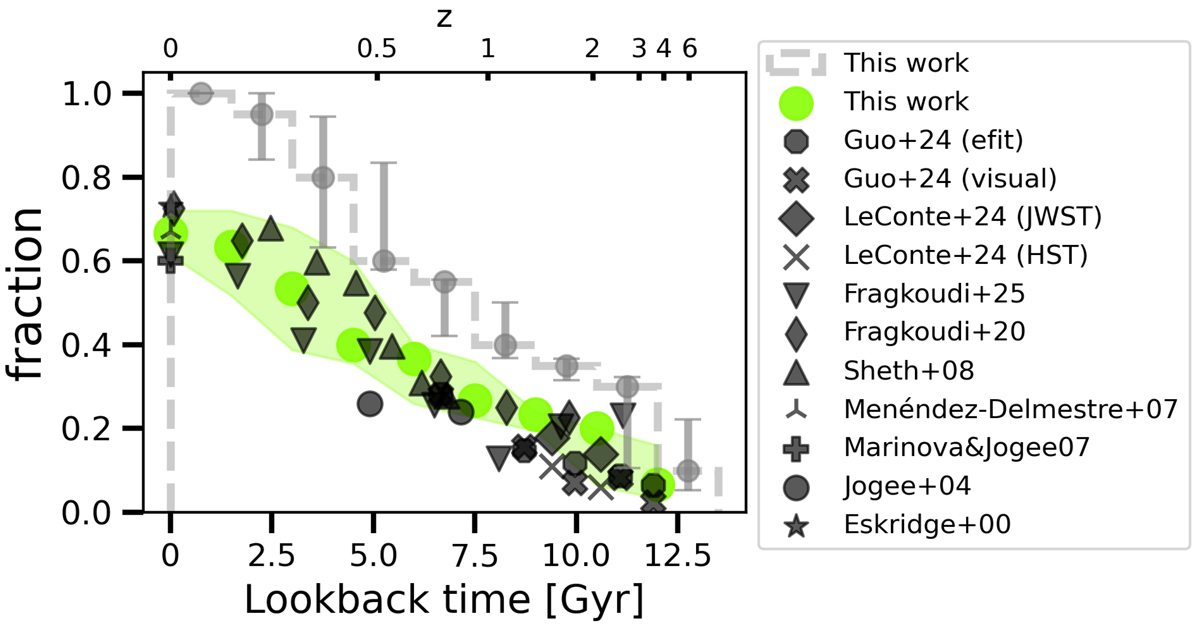
Extrapolated bar fractions for different redshifts from this work. Based on Fig. 4, we display our cumulative distribution (dashed grey histogram) and normalise it by the observed bar fraction in the Local Universe in studies that consider both weak and strong bars (0.67; e.g. Eskridge et al. 2000; Menéndez-Delmestre et al. 2007; Marinova & Jogee 2007). With this, we derive the extrapolated bar fraction over time in our sample (green dots). Additionally, the shaded green region accounts for the systematic error in our bar age measurements of ![]() . With the grey error bars, we also display the likely ranges in the cumulative distribution considering this systematic error as well. We compare our results with the observed bar fraction from different works, finding a remarkable agreement with works that consider both weak and strong bars.
. With the grey error bars, we also display the likely ranges in the cumulative distribution considering this systematic error as well. We compare our results with the observed bar fraction from different works, finding a remarkable agreement with works that consider both weak and strong bars.
Current usage metrics show cumulative count of Article Views (full-text article views including HTML views, PDF and ePub downloads, according to the available data) and Abstracts Views on Vision4Press platform.
Data correspond to usage on the plateform after 2015. The current usage metrics is available 48-96 hours after online publication and is updated daily on week days.
Initial download of the metrics may take a while.