Open Access
Fig. 5
Download original image
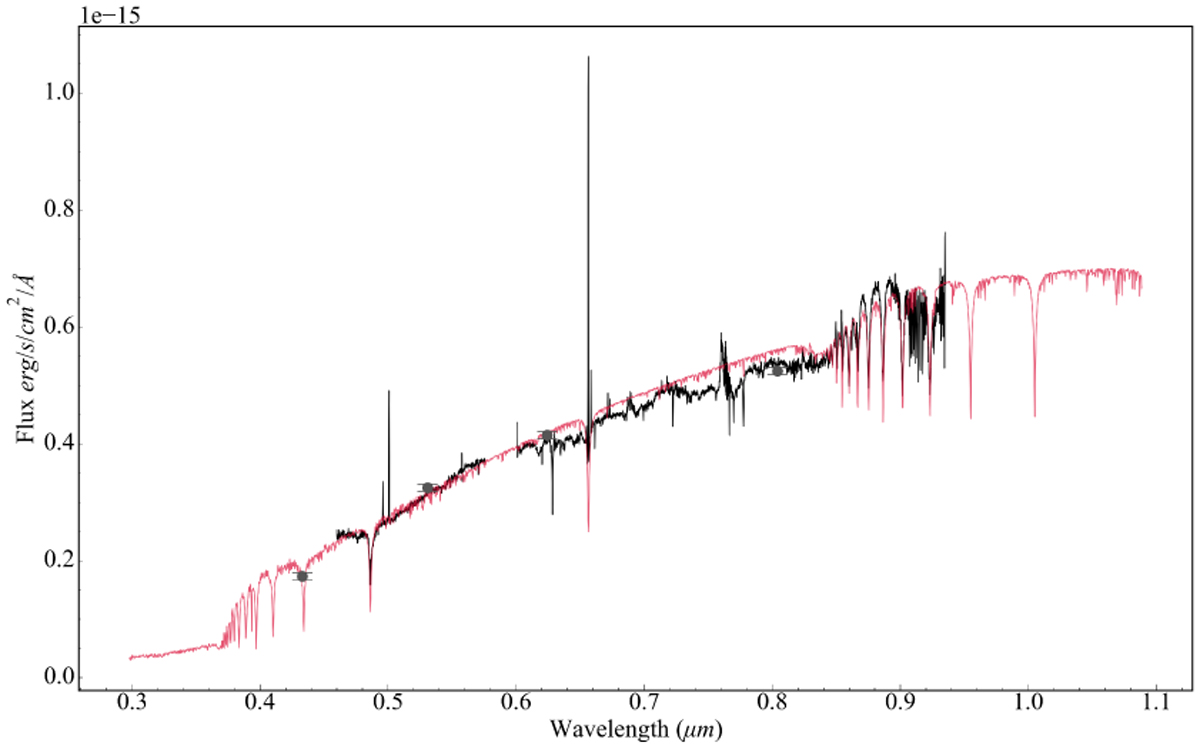
Best fitting optical model spectrum for source 152 based on its MUSE spectrum. The black line corresponds to the MUSE source spectrum, the red line to the best fitting model spectrum, while the HST photometry is shown in grey.
Current usage metrics show cumulative count of Article Views (full-text article views including HTML views, PDF and ePub downloads, according to the available data) and Abstracts Views on Vision4Press platform.
Data correspond to usage on the plateform after 2015. The current usage metrics is available 48-96 hours after online publication and is updated daily on week days.
Initial download of the metrics may take a while.