Fig. 16
Download original image
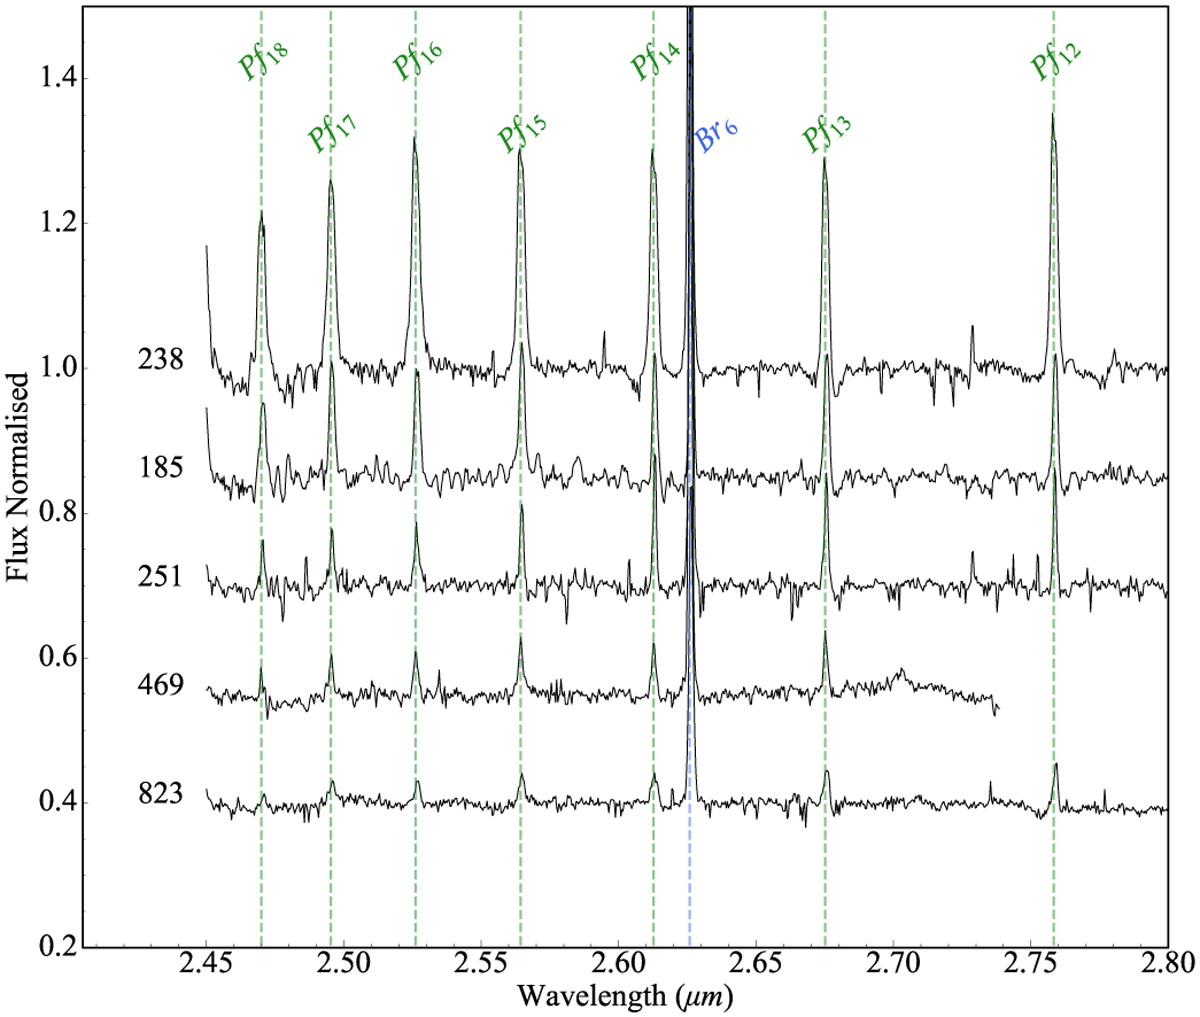
Five PMS sources that display Pfund recombination lines. Their spectra have been normalised to unity, and offset in this figure for visual clarity. The Pfund lines are marked with a green dashed line. Br6 is also present, marked with a blue dashed line. Note that a number of pseudo absorption features are artificially created as a result of our normalisation.
Current usage metrics show cumulative count of Article Views (full-text article views including HTML views, PDF and ePub downloads, according to the available data) and Abstracts Views on Vision4Press platform.
Data correspond to usage on the plateform after 2015. The current usage metrics is available 48-96 hours after online publication and is updated daily on week days.
Initial download of the metrics may take a while.