Open Access
Fig. 10
Download original image
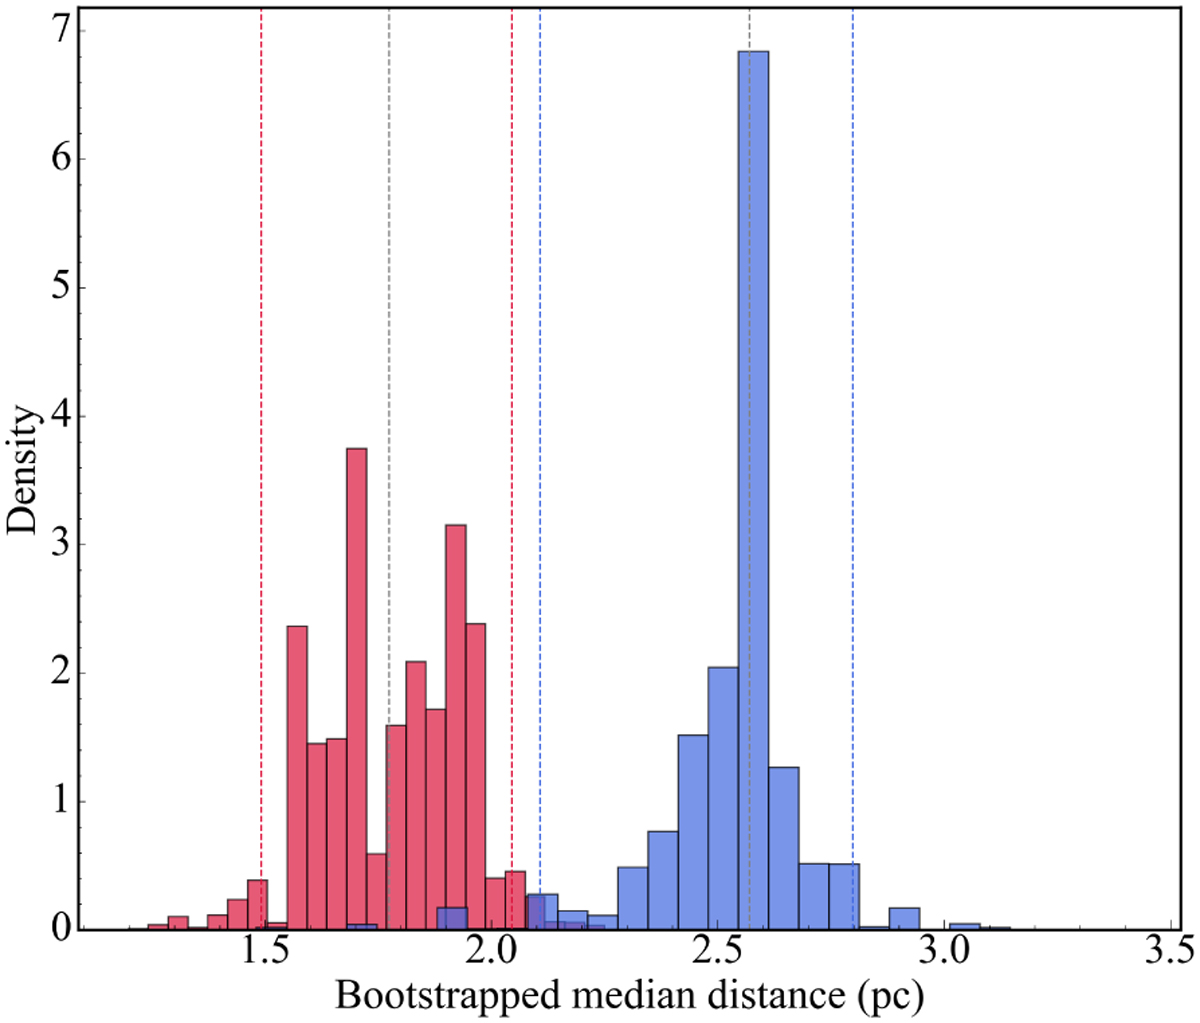
Results of bootstrapping analysis. The projected distances of young stars in red. Old stars in blue. 95% confidence intervals shown as dashed red and blue lines. The median distance is shown as a dashed black line for each distribution.
Current usage metrics show cumulative count of Article Views (full-text article views including HTML views, PDF and ePub downloads, according to the available data) and Abstracts Views on Vision4Press platform.
Data correspond to usage on the plateform after 2015. The current usage metrics is available 48-96 hours after online publication and is updated daily on week days.
Initial download of the metrics may take a while.