Fig. 5.
Download original image
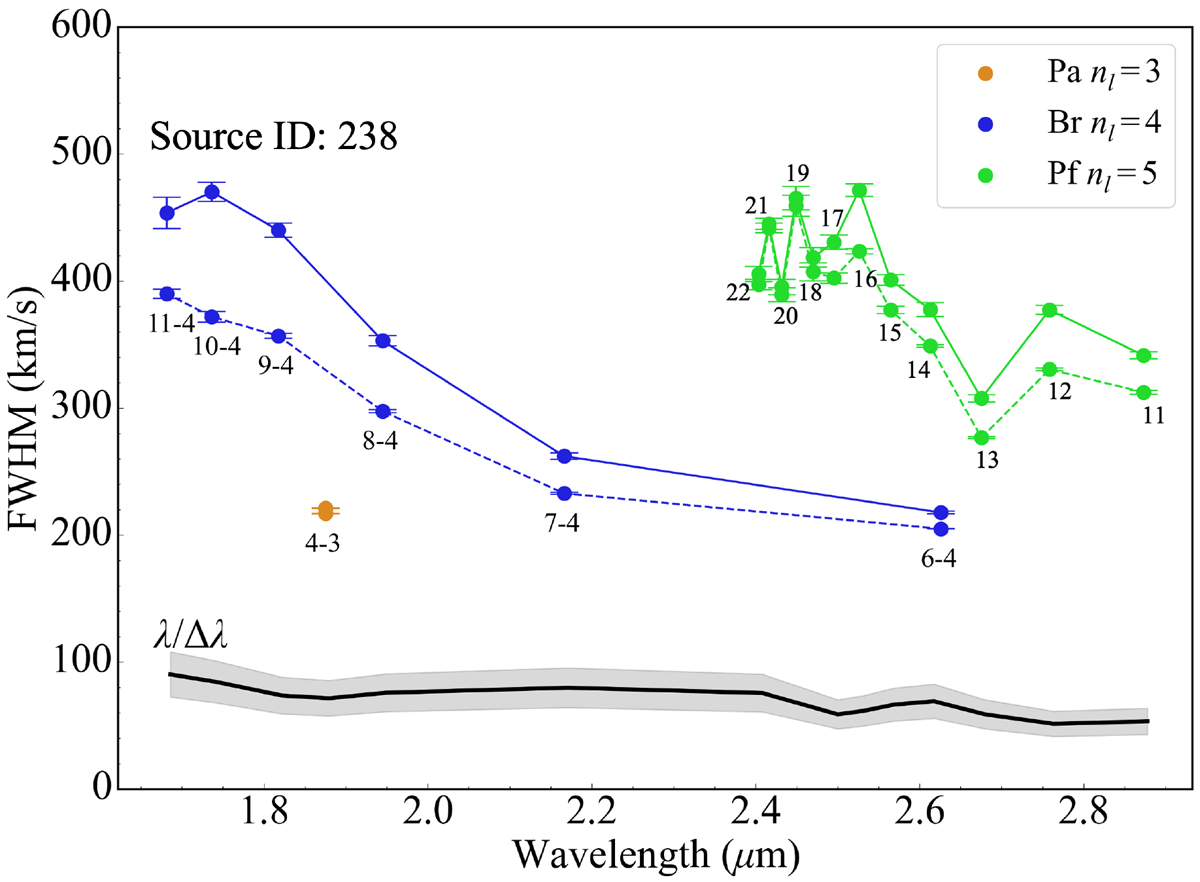
Full width at half maximum of each hydrogen emission line of source 238. The Paschen series is shown in orange, and the Brackett series is shown in blue. The dashed line is before photospheric subtraction, and the solid line is after photospheric subtraction. The Pfund series is shown in green. The dashed line is before photospheric subtraction. The solid line is after photospheric subtraction. The expected instrumental resolution is shown in black. The systematic uncertainty of the spectral resolution is in pale grey. Transition names are indicated. For the Pfund transitions, only nup is shown for visual clarity.
Current usage metrics show cumulative count of Article Views (full-text article views including HTML views, PDF and ePub downloads, according to the available data) and Abstracts Views on Vision4Press platform.
Data correspond to usage on the plateform after 2015. The current usage metrics is available 48-96 hours after online publication and is updated daily on week days.
Initial download of the metrics may take a while.