Fig. 2.
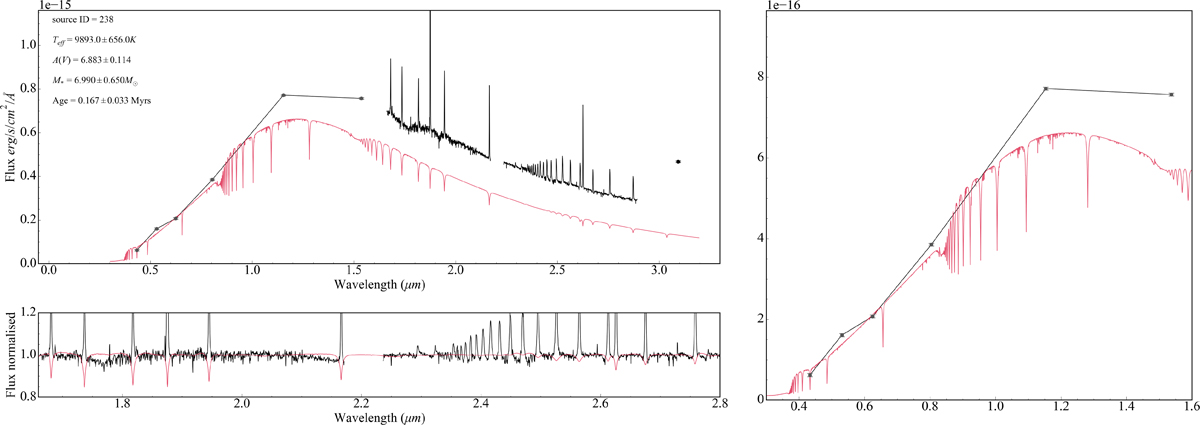
Download original image
Top-left panel – SED of source 238 from 0.4–3 μm. NIRSpec spectrum, with uncertainty represented by error bar (black). HST photometry (grey). Phoenix stellar model (red). Bottom-left panel – Normalised NIRSpec spectrum (black). Phoenix stellar model (red). Best-fitting model shows no metal absorption lines, consistent with the NIRSpec spectrum. All hydrogen absorption lines are filled in by emission. We have removed the bump at 1.71 μm for aesthetic reasons. Right panel – Zoom-in of the optical and IR HST photometry.
Current usage metrics show cumulative count of Article Views (full-text article views including HTML views, PDF and ePub downloads, according to the available data) and Abstracts Views on Vision4Press platform.
Data correspond to usage on the plateform after 2015. The current usage metrics is available 48-96 hours after online publication and is updated daily on week days.
Initial download of the metrics may take a while.