Fig. 1.
Download original image
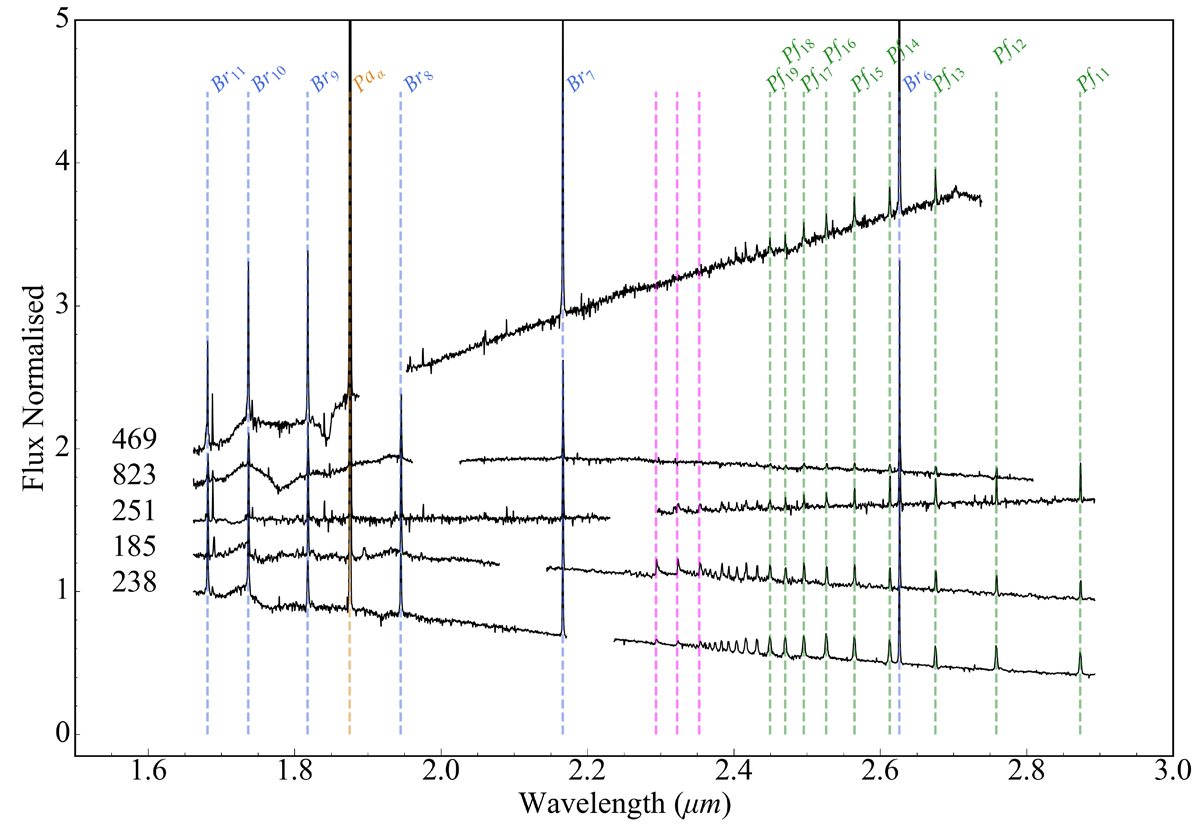
NIRSpec spectra of our five PMS sources. The spectra have been normalised at 1.66 μm. For better visualisation, they have been offset from each other vertically and cut off after the final Pfund line at ∼2.9 μm. Source names are indicated on the left of the spectra. Hydrogen emission lines are marked with vertical dashed lines; the Paschen series is in orange, the Brackett series is in blue, and the Pfund series is in green. The CO bandheads are also indicated with pink dashed lines. A systematic calibration uncertainty impacts the continuum at ∼1.7 μm
Current usage metrics show cumulative count of Article Views (full-text article views including HTML views, PDF and ePub downloads, according to the available data) and Abstracts Views on Vision4Press platform.
Data correspond to usage on the plateform after 2015. The current usage metrics is available 48-96 hours after online publication and is updated daily on week days.
Initial download of the metrics may take a while.