Fig. A.1
Download original image
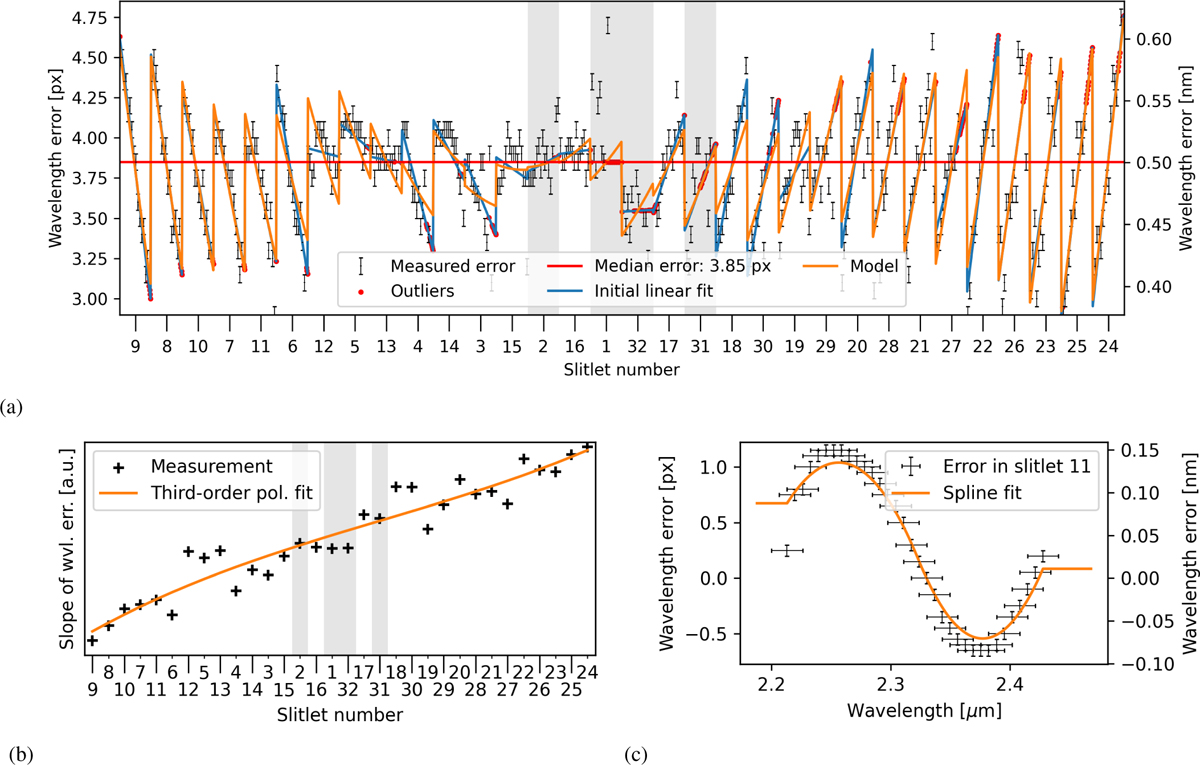
Illustration of the steps involved in our custom wavelength calibration applied to an arbitrary frame. Panel (a): Measurement of the wavelength error across all slitlets by cross-correlating each spaxel with a telluric transmission template (black). We only show every fourth measurement for readability. Bad measurements are indicated by red dots, while the red line indicates the median error over the whole detector. The blue line indicates an initial linear fit of the error over each slitlet. The orange line represents the model created in the first step of our wavelength calibration as described in Sect. 2.2.1 and shown in Fig. A. Panel (b): Slope of the linear fit (blue line in Fig. A) to the wavelength error in each slitlet (black) as described in step 1 of Sect. 2.2.1. The orange line shows the third-order polynomial fit to the data. Panel (c): Measurement of the wavelength error along the wavelength dimension within slitlet 11 (black) as described in step 2 of Sect. 2.2.1. The orange line shows the spline fit to the data. The shaded areas correspond to the slitlets at the top and bottom of the field of view which are cropped out after the wavelength calibration. The figures at the top and on the bottom left illustrate step 1 whilst the figure on the bottom right shows step 2.
Current usage metrics show cumulative count of Article Views (full-text article views including HTML views, PDF and ePub downloads, according to the available data) and Abstracts Views on Vision4Press platform.
Data correspond to usage on the plateform after 2015. The current usage metrics is available 48-96 hours after online publication and is updated daily on week days.
Initial download of the metrics may take a while.