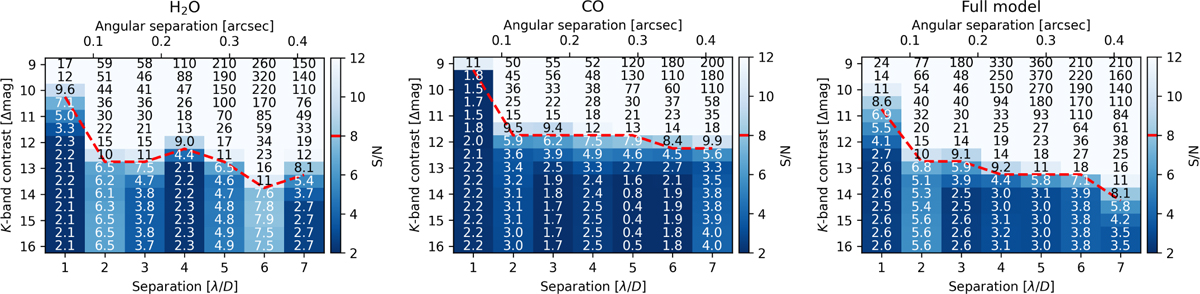
Fig. 6
Download original image
Contrast grids computed by injecting fake planets with our full model spectrum from Sect. 3.1 at different contrast and angular separation from the host star and retrieving them in the molecular maps of H2O (left), CO (centre), and with the full model (right). The dashed red line corresponds to a S/N of 8, which we use as the detection threshold to compute our detection limits.
Current usage metrics show cumulative count of Article Views (full-text article views including HTML views, PDF and ePub downloads, according to the available data) and Abstracts Views on Vision4Press platform.
Data correspond to usage on the plateform after 2015. The current usage metrics is available 48-96 hours after online publication and is updated daily on week days.
Initial download of the metrics may take a while.