Fig. 5
Download original image
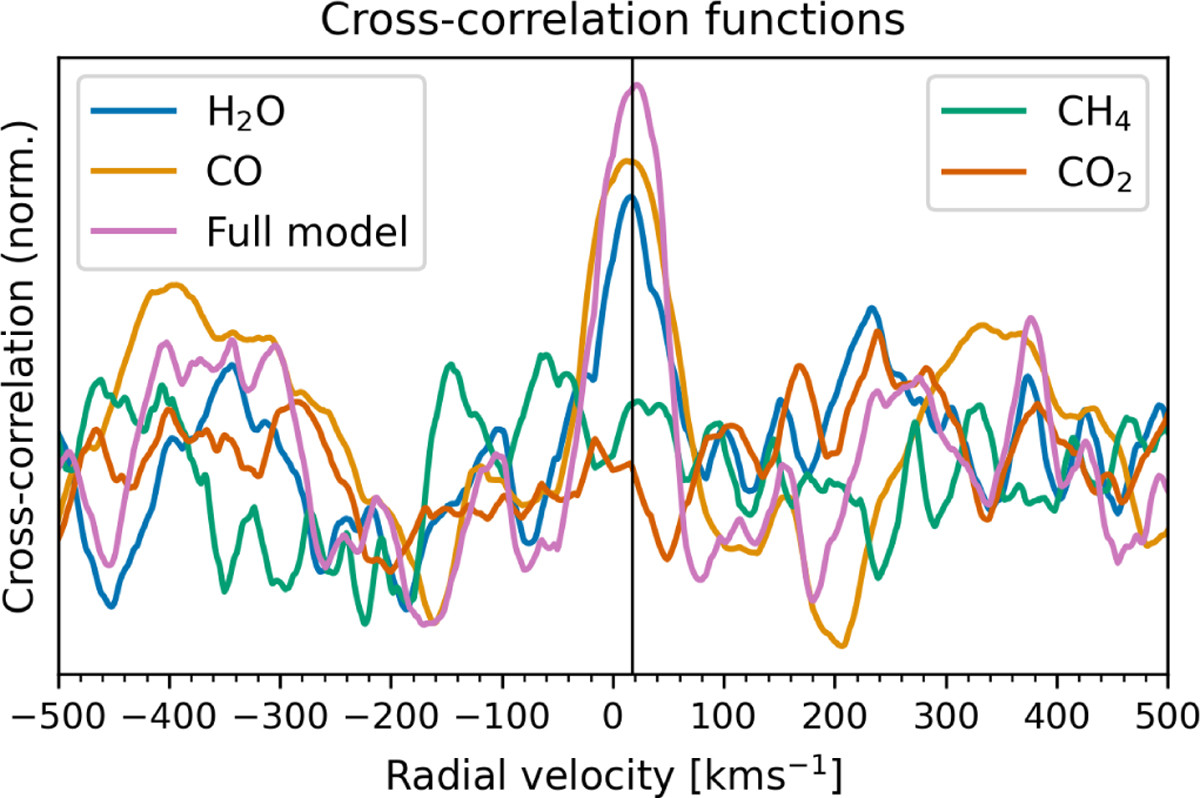
Cross-correlation functions with molecular templates at the position of the planet in Fig. 3. The peaks indicate the presence of H2O and CO in the atmosphere of AF Lep b at an (uncalibrated) RV of approximately 20 km s−1 (vertical line). The cross-correlation functions were standardised over the spatial axes in the same way as our molecular maps: the cross-correlation map at each RV was mean-subtracted and normalised by its standard deviation over the whole image.
Current usage metrics show cumulative count of Article Views (full-text article views including HTML views, PDF and ePub downloads, according to the available data) and Abstracts Views on Vision4Press platform.
Data correspond to usage on the plateform after 2015. The current usage metrics is available 48-96 hours after online publication and is updated daily on week days.
Initial download of the metrics may take a while.