Open Access
Fig. 4
Download original image
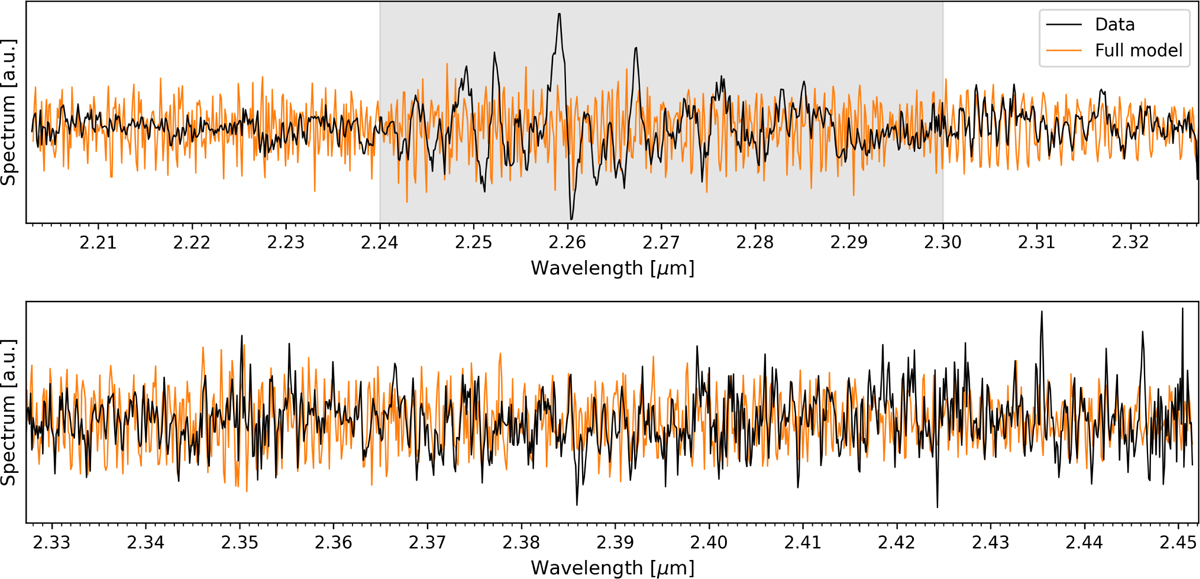
Spectrum of AF Lep b after PSF subtraction (black) compared to our full model (orange). The CO-dominated region between 2.30 μm and 2.32 μm matches the model particularly well despite the low S/N of the data. The shaded area represents the mask applied to the data to remove the instrument stray light described in Sect. 2.2.
Current usage metrics show cumulative count of Article Views (full-text article views including HTML views, PDF and ePub downloads, according to the available data) and Abstracts Views on Vision4Press platform.
Data correspond to usage on the plateform after 2015. The current usage metrics is available 48-96 hours after online publication and is updated daily on week days.
Initial download of the metrics may take a while.